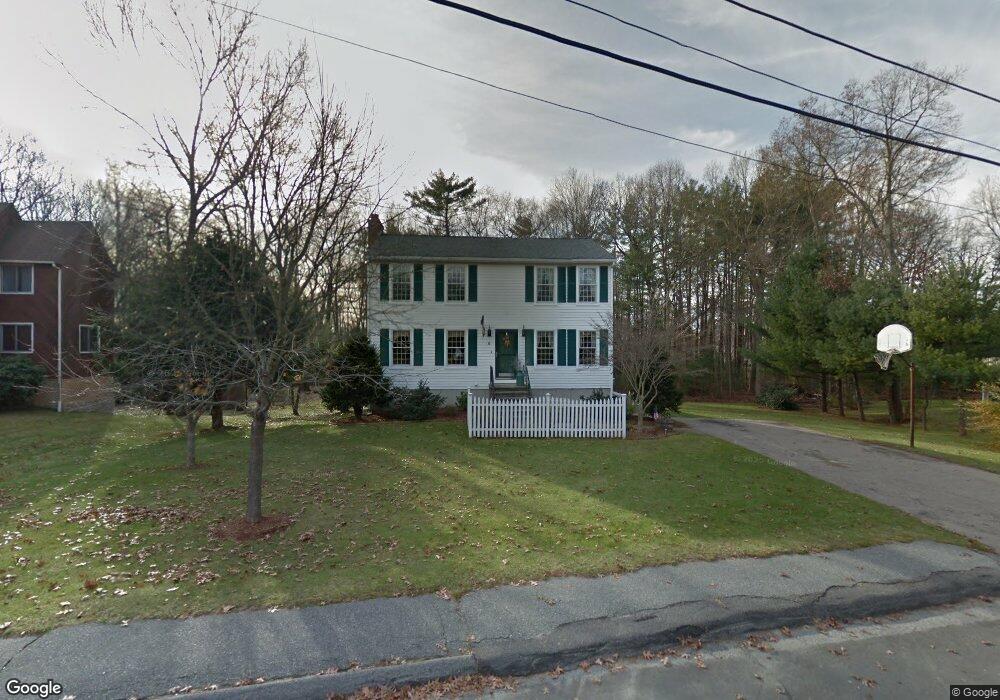
11 Nancy Ct Blackstone, MA 01504
Estimated Value: $470,000 - $543,000
3
Beds
2
Baths
1,768
Sq Ft
$288/Sq Ft
Est. Value
About This Home
This home is located at 11 Nancy Ct, Blackstone, MA 01504 and is currently estimated at $508,551, approximately $287 per square foot. 11 Nancy Ct is a home located in Worcester County with nearby schools including Blackstone-Millville Regional High School, Rise Prep Mayoral Academy Middle School, and Founders Academy.
Ownership History
Date
Name
Owned For
Owner Type
Purchase Details
Closed on
Aug 4, 2017
Sold by
Salome Linda A
Bought by
Salome Linda A and Salome William A
Current Estimated Value
Purchase Details
Closed on
Feb 24, 2017
Sold by
Salome William A and Salome Linda A
Bought by
Salome Linda A
Create a Home Valuation Report for This Property
The Home Valuation Report is an in-depth analysis detailing your home's value as well as a comparison with similar homes in the area
Home Values in the Area
Average Home Value in this Area
Purchase History
| Date | Buyer | Sale Price | Title Company |
|---|---|---|---|
| Salome Linda A | -- | -- | |
| Salome Linda A | -- | -- |
Source: Public Records
Tax History
| Year | Tax Paid | Tax Assessment Tax Assessment Total Assessment is a certain percentage of the fair market value that is determined by local assessors to be the total taxable value of land and additions on the property. | Land | Improvement |
|---|---|---|---|---|
| 2025 | $6,088 | $403,200 | $166,900 | $236,300 |
| 2024 | $6,503 | $398,200 | $181,900 | $216,300 |
| 2023 | $6,142 | $379,600 | $181,900 | $197,700 |
| 2022 | $5,954 | $332,600 | $150,300 | $182,300 |
| 2021 | $5,891 | $314,700 | $147,800 | $166,900 |
| 2020 | $5,894 | $312,500 | $147,300 | $165,200 |
| 2019 | $5,743 | $303,700 | $136,700 | $167,000 |
| 2018 | $5,498 | $282,100 | $130,700 | $151,400 |
| 2017 | $5,239 | $272,000 | $130,700 | $141,300 |
| 2016 | $5,139 | $265,700 | $118,000 | $147,700 |
| 2015 | $5,098 | $261,700 | $120,100 | $141,600 |
Source: Public Records
Map
Nearby Homes
- 12 Market St
- 122 Canal St
- 76 Main St
- 84 Saint Paul St
- 0 Main St
- 1 Tupperware Dr Unit 138
- 1 Tupperware Dr Unit 221
- 1 Tupperware Dr Unit 241
- 81 Fountain St
- 11 Federal St
- 29 Graves Ave
- 10 Huntington Ave
- 44 Federal St
- 60 Fairlawn Ave
- 162 Blackstone St
- 4 Sharon Pkwy
- 542 Prospect St
- 183-183R Mendon St
- 458 Prospect St
- 56 Winter St
Your Personal Tour Guide
Ask me questions while you tour the home.