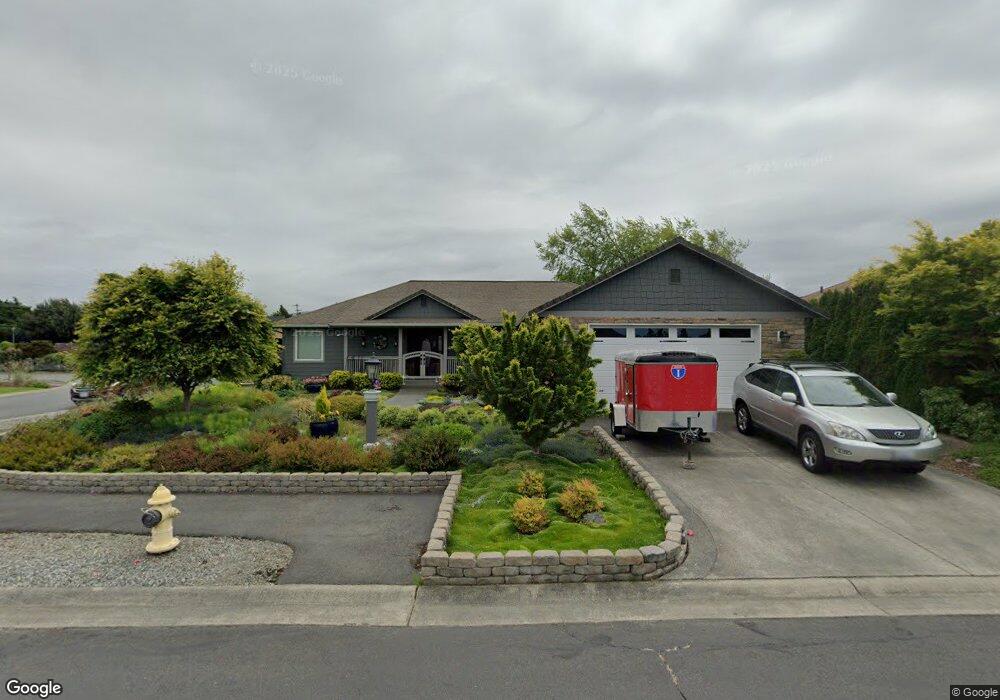
11 Nesting Place Sequim, WA 98382
Estimated Value: $575,787 - $665,000
3
Beds
2
Baths
1,869
Sq Ft
$333/Sq Ft
Est. Value
About This Home
This home is located at 11 Nesting Place, Sequim, WA 98382 and is currently estimated at $622,262, approximately $332 per square foot. 11 Nesting Place is a home located in Clallam County with nearby schools including Helen Haller Elementary School, Sequim Middle School, and Sequim Senior High School.
Ownership History
Date
Name
Owned For
Owner Type
Purchase Details
Closed on
Feb 25, 2019
Sold by
Horlick Zoe L and Zoe L Horlick Trust
Bought by
Maynard Frank W and Maynard Stephanie M
Current Estimated Value
Home Financials for this Owner
Home Financials are based on the most recent Mortgage that was taken out on this home.
Original Mortgage
$381,000
Outstanding Balance
$334,964
Interest Rate
4.4%
Mortgage Type
VA
Estimated Equity
$287,298
Purchase Details
Closed on
Jan 10, 2019
Sold by
Horlick Zoe L
Bought by
Horlick Zoe L
Home Financials for this Owner
Home Financials are based on the most recent Mortgage that was taken out on this home.
Original Mortgage
$381,000
Outstanding Balance
$334,964
Interest Rate
4.4%
Mortgage Type
VA
Estimated Equity
$287,298
Purchase Details
Closed on
Mar 2, 2018
Sold by
Horlick Ronald P
Bought by
Horlick Zoe L
Purchase Details
Closed on
Sep 28, 2005
Sold by
Balkan Scott M and Balkan Rebecca
Bought by
Horlick Ronald P and Horlick Zoe L
Home Financials for this Owner
Home Financials are based on the most recent Mortgage that was taken out on this home.
Original Mortgage
$70,000
Interest Rate
5.72%
Mortgage Type
New Conventional
Create a Home Valuation Report for This Property
The Home Valuation Report is an in-depth analysis detailing your home's value as well as a comparison with similar homes in the area
Purchase History
| Date | Buyer | Sale Price | Title Company |
|---|---|---|---|
| Maynard Frank W | $381,000 | Clallam Title Co | |
| Horlick Zoe L | -- | None Available | |
| Horlick Zoe L | -- | None Available | |
| Horlick Ronald P | $335,000 | Olympic Peninsula Title Co |
Source: Public Records
Mortgage History
| Date | Status | Borrower | Loan Amount |
|---|---|---|---|
| Open | Maynard Frank W | $381,000 | |
| Previous Owner | Horlick Ronald P | $70,000 |
Source: Public Records
Tax History
| Year | Tax Paid | Tax Assessment Tax Assessment Total Assessment is a certain percentage of the fair market value that is determined by local assessors to be the total taxable value of land and additions on the property. | Land | Improvement |
|---|---|---|---|---|
| 2025 | $3,951 | $542,587 | $93,170 | $449,417 |
| 2023 | $3,951 | $522,780 | $80,500 | $442,280 |
| 2022 | $4,134 | $535,913 | $70,000 | $465,913 |
| 2021 | $3,719 | $447,133 | $55,000 | $392,133 |
| 2020 | $3,806 | $396,111 | $39,627 | $356,484 |
| 2018 | $3,065 | $334,999 | $39,627 | $295,372 |
| 2017 | $2,329 | $273,935 | $39,627 | $234,308 |
| 2016 | $2,424 | $277,057 | $39,627 | $237,430 |
| 2015 | $2,329 | $246,843 | $39,627 | $207,216 |
| 2013 | $2,329 | $228,005 | $39,627 | $188,378 |
| 2012 | $2,329 | $230,877 | $40,256 | $190,621 |
Source: Public Records
Map
Nearby Homes
- 881 N Iris Ave
- 71 Heron Way Unit A
- 71 Heron Way Unit B
- 181 Duke Dr
- 896 N Rock Rose Ave
- 866 N Rock Rose Ave Unit N Rock Rose Ave
- 866 N Rock Rose Ave
- 886 N Rock Rose Ave
- 420 Cove Ln
- 920 Starboard Way
- 955 N 5th Ave
- 148 Sunland Dr
- 871 N Oxford Way
- 892 N Oxford Way Unit 617
- 187 Sunland Dr
- 830 N Canterbury Ct
- 842 N Canterbury Ct
- 844 N Canterbury Ct
- 833 N Canterbury Ct
- 560 W Minstrel Rd
- 13 Choice Loop
- 31 Nesting Place
- L57 Choice Loop
- L21 Choice Loop
- 24 lot Choice Loop
- 25 lot Choice Loop
- 10 Choice Loop
- 0 Choice Loop Unit 28143650
- 0 Choice Loop Unit 28136003
- 0 Choice Loop Unit 28049011
- 24 Choice Loop
- 0 Choice Loop Unit 1730598
- 20 Choice Loop
- 0 Lot 10 Choice Loop
- XXX Choice Loop
- Lot 8 Choice Loop
- Lot 9 Choice Loop
- Lot 7 Choice Loop
- Lot 34 Choice Loop
- Lot 1 Choice Loop
Your Personal Tour Guide
Ask me questions while you tour the home.