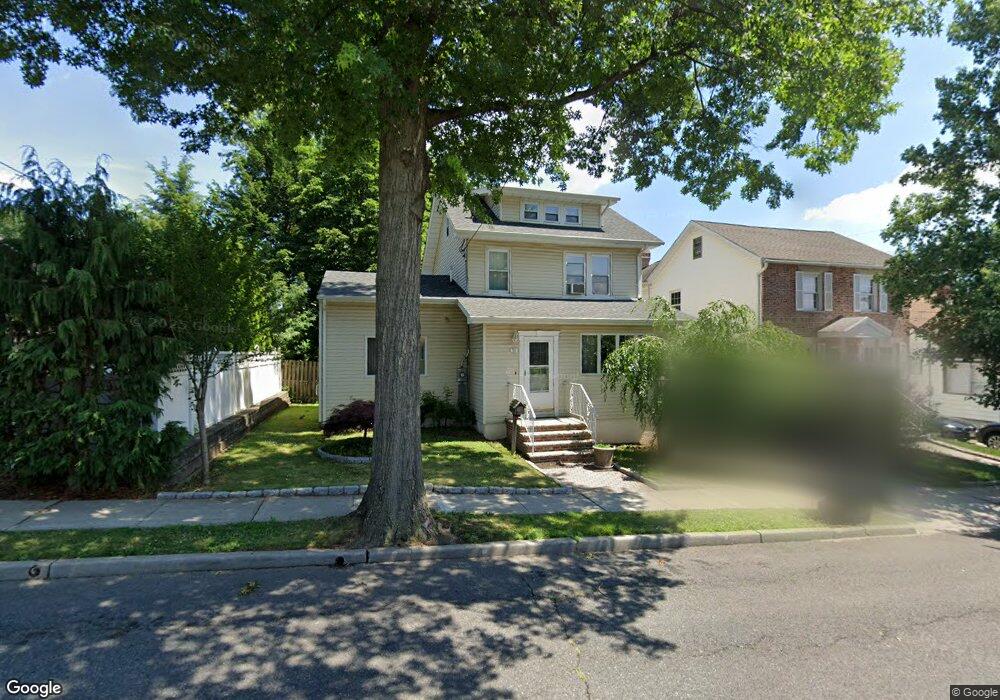
11 Nevins St Rutherford, NJ 07070
Estimated Value: $677,795 - $945,000
4
Beds
2
Baths
1,820
Sq Ft
$465/Sq Ft
Est. Value
About This Home
This home is located at 11 Nevins St, Rutherford, NJ 07070 and is currently estimated at $846,449, approximately $465 per square foot. 11 Nevins St is a home located in Bergen County with nearby schools including Rutherford High School, Sacred Heart School, and The Meadows School.
Ownership History
Date
Name
Owned For
Owner Type
Purchase Details
Closed on
Aug 17, 2021
Sold by
Moh Soon Cheol and Jung Jiyun
Bought by
Rana Purvi and Rana Nileshkumar T
Current Estimated Value
Home Financials for this Owner
Home Financials are based on the most recent Mortgage that was taken out on this home.
Original Mortgage
$398,900
Interest Rate
2.8%
Mortgage Type
New Conventional
Purchase Details
Closed on
Jan 12, 2000
Sold by
Moh Soon Cheol and Lee Soo Yon
Bought by
Moh Soon Cheol
Home Financials for this Owner
Home Financials are based on the most recent Mortgage that was taken out on this home.
Original Mortgage
$172,000
Interest Rate
7.83%
Purchase Details
Closed on
Jun 27, 1994
Sold by
Bernarducci Angelo
Bought by
Moh Soon Cheol and Lee Soo Yon
Home Financials for this Owner
Home Financials are based on the most recent Mortgage that was taken out on this home.
Original Mortgage
$140,000
Interest Rate
8.55%
Create a Home Valuation Report for This Property
The Home Valuation Report is an in-depth analysis detailing your home's value as well as a comparison with similar homes in the area
Home Values in the Area
Average Home Value in this Area
Purchase History
| Date | Buyer | Sale Price | Title Company |
|---|---|---|---|
| Rana Purvi | $489,900 | Sunnyside Title Agency Llc | |
| Moh Soon Cheol | -- | Old Republic Natl Title Ins | |
| Moh Soon Cheol | $200,000 | -- |
Source: Public Records
Mortgage History
| Date | Status | Borrower | Loan Amount |
|---|---|---|---|
| Previous Owner | Rana Purvi | $398,900 | |
| Previous Owner | Moh Soon Cheol | $172,000 | |
| Previous Owner | Moh Soon Cheol | $140,000 |
Source: Public Records
Tax History Compared to Growth
Tax History
| Year | Tax Paid | Tax Assessment Tax Assessment Total Assessment is a certain percentage of the fair market value that is determined by local assessors to be the total taxable value of land and additions on the property. | Land | Improvement |
|---|---|---|---|---|
| 2025 | $13,689 | $438,600 | $249,100 | $189,500 |
| 2024 | $13,342 | $438,600 | $249,100 | $189,500 |
| 2023 | $14,147 | $438,600 | $249,100 | $189,500 |
| 2022 | $14,147 | $476,500 | $249,100 | $227,400 |
| 2021 | $13,957 | $476,500 | $249,100 | $227,400 |
| 2020 | $13,585 | $476,500 | $249,100 | $227,400 |
| 2019 | $13,051 | $476,500 | $249,100 | $227,400 |
| 2018 | $12,870 | $476,500 | $249,100 | $227,400 |
| 2017 | $12,689 | $476,500 | $249,100 | $227,400 |
| 2016 | $12,408 | $476,500 | $249,100 | $227,400 |
| 2015 | $12,070 | $476,500 | $249,100 | $227,400 |
| 2014 | $11,693 | $476,500 | $249,100 | $227,400 |
Source: Public Records
Map
Nearby Homes