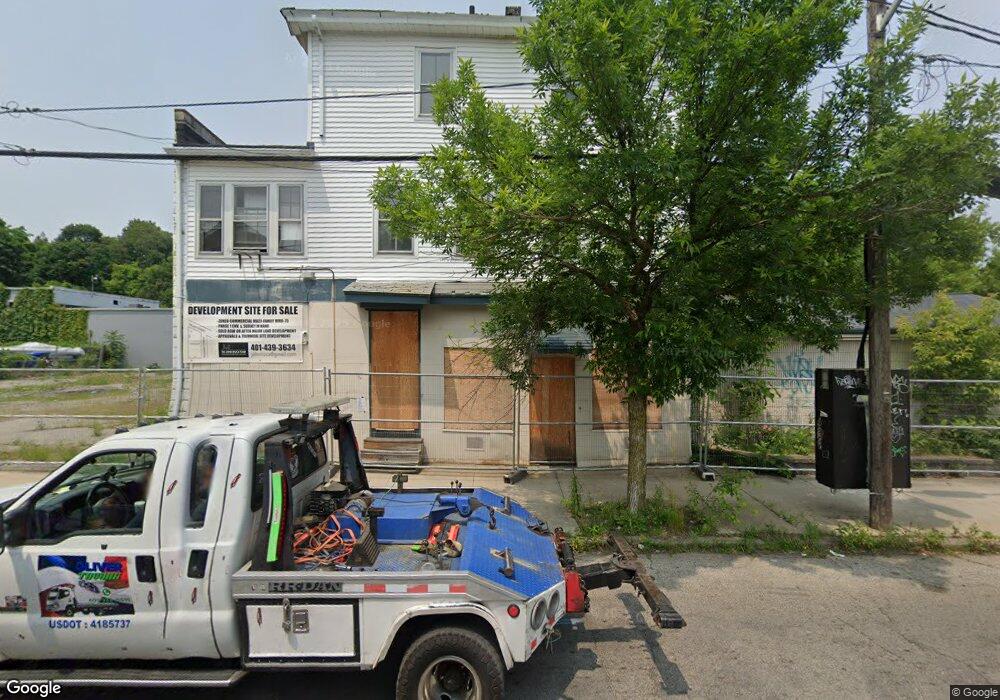
11 Newark St Providence, RI 02908
Valley NeighborhoodEstimated Value: $1,450,014
1
Bed
1
Bath
6,351
Sq Ft
$228/Sq Ft
Est. Value
About This Home
This home is located at 11 Newark St, Providence, RI 02908 and is currently estimated at $1,450,014, approximately $228 per square foot. 11 Newark St is a home located in Providence County with nearby schools including Asa Messer Elementary School, Charles N. Fortes Elementary School, and Laurel Hill Annex School.
Ownership History
Date
Name
Owned For
Owner Type
Purchase Details
Closed on
Nov 5, 2025
Sold by
Omni Newark Apts Lp
Bought by
Rhode Is Hsng & Mtg Fin C
Current Estimated Value
Home Financials for this Owner
Home Financials are based on the most recent Mortgage that was taken out on this home.
Original Mortgage
$10,600,000
Outstanding Balance
$10,600,000
Interest Rate
6.3%
Mortgage Type
Future Advance Clause Open End Mortgage
Estimated Equity
-$9,149,986
Purchase Details
Closed on
Nov 14, 2023
Sold by
Ri Hsng And Mtg Fin Corp
Bought by
Omni Development Corp
Purchase Details
Closed on
Apr 22, 2022
Sold by
Newark Investments Llc
Bought by
Kingdom T Co
Purchase Details
Closed on
Nov 9, 2007
Sold by
Joseph Mega Inc
Bought by
Newark Investment Llc
Home Financials for this Owner
Home Financials are based on the most recent Mortgage that was taken out on this home.
Original Mortgage
$1,200,000
Interest Rate
6.47%
Mortgage Type
Commercial
Create a Home Valuation Report for This Property
The Home Valuation Report is an in-depth analysis detailing your home's value as well as a comparison with similar homes in the area
Home Values in the Area
Average Home Value in this Area
Purchase History
| Date | Buyer | Sale Price | Title Company |
|---|---|---|---|
| Rhode Is Hsng & Mtg Fin C | -- | -- | |
| Omni Newark Apts Lp | -- | -- | |
| Omni Development Corp | -- | None Available | |
| Omni Development Corp | $1,200,000 | None Available | |
| Kingdom T Co | $550,000 | None Available | |
| Newark Investment Llc | $415,000 | -- |
Source: Public Records
Mortgage History
| Date | Status | Borrower | Loan Amount |
|---|---|---|---|
| Open | Omni Newark Apts Lp | $10,600,000 | |
| Closed | Rhode Is Hsng & Mtg Fin C | $1,251,861 | |
| Previous Owner | Newark Investment Llc | $1,200,000 |
Source: Public Records
Tax History Compared to Growth
Tax History
| Year | Tax Paid | Tax Assessment Tax Assessment Total Assessment is a certain percentage of the fair market value that is determined by local assessors to be the total taxable value of land and additions on the property. | Land | Improvement |
|---|---|---|---|---|
| 2025 | $10,705 | $733,200 | $370,800 | $362,400 |
| 2024 | -- | $352,100 | $112,300 | $239,800 |
| 2023 | $0 | $352,100 | $112,300 | $239,800 |
| 2022 | $0 | $318,700 | $112,300 | $206,400 |
| 2021 | $0 | $265,900 | $98,600 | $167,300 |
| 2020 | $0 | $265,900 | $98,600 | $167,300 |
| 2019 | $0 | $265,900 | $98,600 | $167,300 |
| 2018 | $0 | $237,700 | $98,600 | $139,100 |
| 2017 | $0 | $237,700 | $98,600 | $139,100 |
| 2016 | -- | $237,700 | $98,600 | $139,100 |
| 2015 | -- | $223,900 | $93,900 | $130,000 |
| 2014 | -- | $223,900 | $93,900 | $130,000 |
| 2013 | -- | $223,900 | $93,900 | $130,000 |
Source: Public Records
Map
Nearby Homes