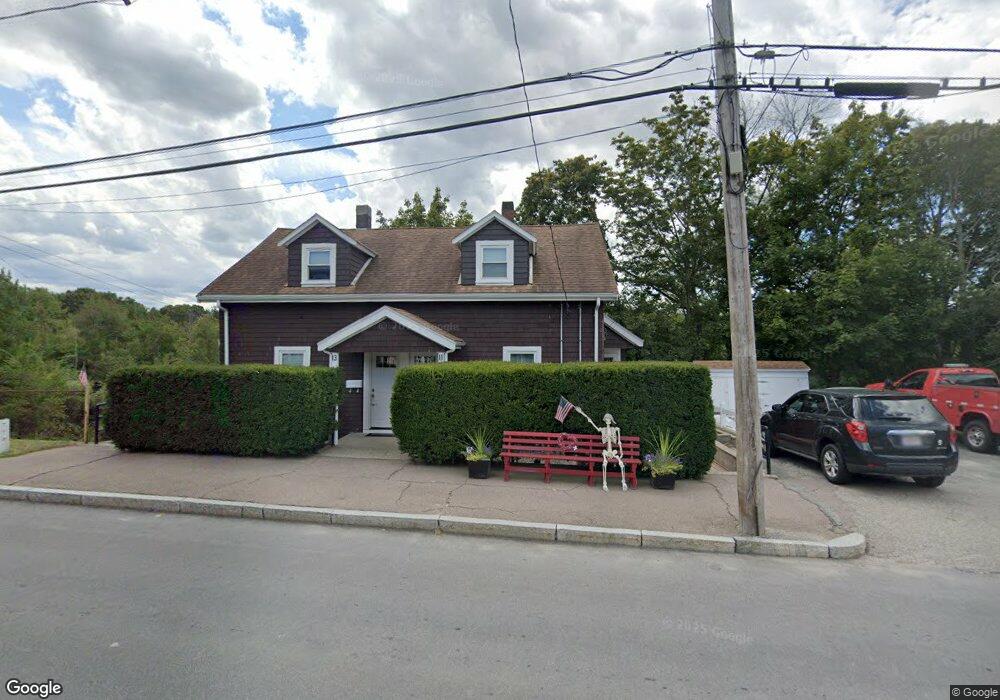
11 Newbridge St Hingham, MA 02043
Estimated Value: $809,000 - $942,000
5
Beds
2
Baths
1,659
Sq Ft
$531/Sq Ft
Est. Value
About This Home
This home is located at 11 Newbridge St, Hingham, MA 02043 and is currently estimated at $880,481, approximately $530 per square foot. 11 Newbridge St is a home located in Plymouth County with nearby schools including Plymouth River Elementary School, Hingham Middle School, and Hingham High School.
Ownership History
Date
Name
Owned For
Owner Type
Purchase Details
Closed on
Oct 16, 2024
Sold by
Dempsey Julie L
Bought by
Dempsey Daniel J and Dempsey Jared D
Current Estimated Value
Purchase Details
Closed on
Feb 26, 2008
Sold by
Schirmer Jane E
Bought by
Dempsey Julie Lynn
Create a Home Valuation Report for This Property
The Home Valuation Report is an in-depth analysis detailing your home's value as well as a comparison with similar homes in the area
Purchase History
| Date | Buyer | Sale Price | Title Company |
|---|---|---|---|
| Dempsey Daniel J | -- | None Available | |
| Dempsey Daniel J | -- | None Available | |
| Dempsey Julie Lynn | -- | -- | |
| Dempsey Julie Lynn | -- | -- |
Source: Public Records
Mortgage History
| Date | Status | Borrower | Loan Amount |
|---|---|---|---|
| Previous Owner | Dempsey Julie Lynn | $50,000 | |
| Previous Owner | Dempsey Julie Lynn | $32,000 |
Source: Public Records
Tax History
| Year | Tax Paid | Tax Assessment Tax Assessment Total Assessment is a certain percentage of the fair market value that is determined by local assessors to be the total taxable value of land and additions on the property. | Land | Improvement |
|---|---|---|---|---|
| 2025 | $7,603 | $711,200 | $339,200 | $372,000 |
| 2024 | $7,248 | $668,000 | $339,200 | $328,800 |
| 2023 | $5,992 | $599,200 | $315,000 | $284,200 |
| 2022 | $5,904 | $510,700 | $274,600 | $236,100 |
| 2021 | $5,647 | $478,600 | $274,600 | $204,000 |
| 2020 | $5,518 | $478,600 | $274,600 | $204,000 |
| 2019 | $5,441 | $460,700 | $274,600 | $186,100 |
| 2018 | $5,380 | $457,100 | $274,600 | $182,500 |
| 2017 | $5,388 | $439,800 | $282,600 | $157,200 |
| 2016 | $5,324 | $426,300 | $269,100 | $157,200 |
| 2015 | $4,947 | $394,800 | $237,600 | $157,200 |
Source: Public Records
Map
Nearby Homes
- 156 Fort Hill St
- 6 Brewer Way
- 6 Adams Ct
- 7 Lewis Ct
- 225 South St Unit 1
- 21 Hersey St
- 1 Squirrel Hill Ln
- 19 Lantern Ln
- 1206 Tuckers Ln Unit 1206
- 428 Main St
- 43 Park View Dr
- 168 Stayner Dr Unit 168
- 1 Hemlock Rd
- 425 East St
- 30 Puritan Rd
- 2 Langlee Rd
- 6 Leavitt St
- 92 Doris Dr
- 109 Merryknoll Rd
- 11 Berkley Cir
- 7 Newbridge St
- 12 Newbridge St
- 12 Newbridge St Unit 1
- 8 Newbridge St
- 18 Newbridge St
- 4 Newbridge St
- 106 Fort Hill St
- 106 Fort Hill St
- 96 Fort Hill St
- 92 Fort Hill St
- 92 Fort Hill St Unit R
- 111 Fort Hill St
- 90 Fort Hill St
- 120 Fort Hill St
- 107 Fort Hill St
- 31 Newbridge St
- 117 Fort Hill St
- 103 Fort Hill St
- 2 Charles Everett Way
- 88 Fort Hill St
Your Personal Tour Guide
Ask me questions while you tour the home.