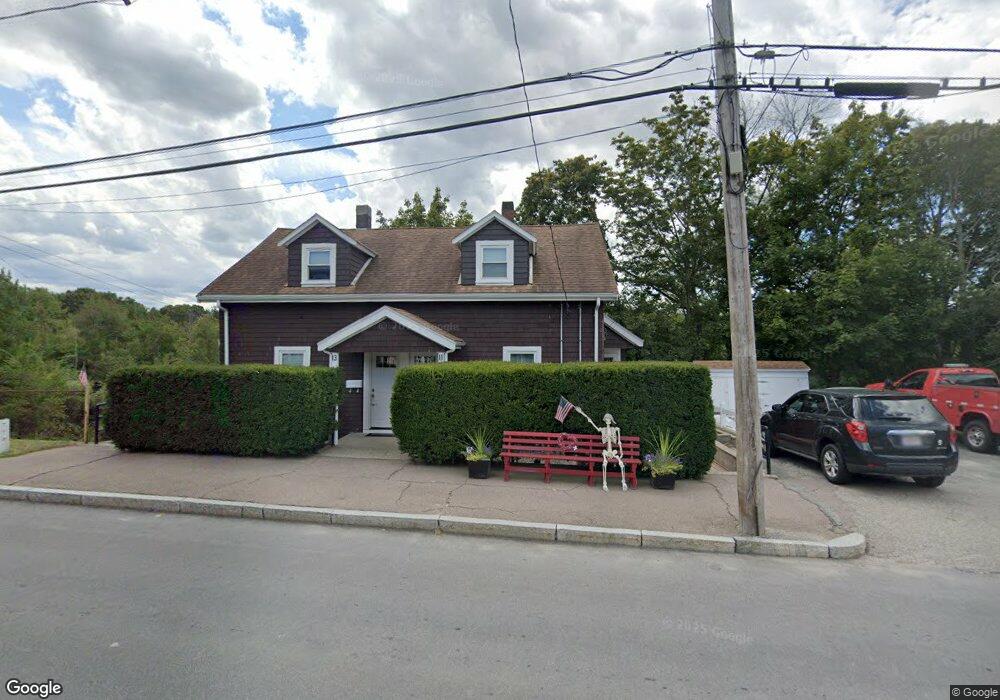
11 Newbridge St Hingham, MA 02043
Hingham AreaEstimated Value: $819,000 - $934,200
About This Home
This home is located at 11 Newbridge St, Hingham, MA 02043 and is currently estimated at $894,550, approximately $539 per square foot. 11 Newbridge St is a home located in Plymouth County with nearby schools including Plymouth River Elementary School, Hingham Middle School, and Hingham High School.
Ownership History
We collect this data history from publicly available records. To have your information removed, we recommend requesting removal directly through your county’s website.
Purchase Details
Purchase Details
Purchase History
We collect this data history from publicly available records. To have your information removed, we recommend requesting removal directly through your county’s website.
| Date | Buyer | Sale Price | Title Company |
|---|---|---|---|
| -- | None Available | ||
| -- | -- |
Mortgage History
We collect this data history from publicly available records. To have your information removed, we recommend requesting removal directly through your county’s website.
| Date | Status | Borrower | Loan Amount |
|---|---|---|---|
| Previous Owner | $50,000 | ||
| Previous Owner | $35,000 |
Tax History
We collect this data history from publicly available records. To have your information removed, we recommend requesting removal directly through your county’s website.
| Year | Tax Paid | Tax Assessment Tax Assessment Total Assessment is a certain percentage of the fair market value that is determined by local assessors to be the total taxable value of land and additions on the property. | Land | Improvement |
|---|---|---|---|---|
| 2025 | $7,603 | $711,200 | $339,200 | $372,000 |
| 2024 | $7,248 | $668,000 | $339,200 | $328,800 |
| 2023 | $5,992 | $599,200 | $315,000 | $284,200 |
| 2022 | $5,904 | $510,700 | $274,600 | $236,100 |
| 2021 | $5,647 | $478,600 | $274,600 | $204,000 |
| 2020 | $5,518 | $478,600 | $274,600 | $204,000 |
| 2019 | $5,441 | $460,700 | $274,600 | $186,100 |
| 2018 | $5,380 | $457,100 | $274,600 | $182,500 |
| 2017 | $5,388 | $439,800 | $282,600 | $157,200 |
| 2016 | $5,324 | $426,300 | $269,100 | $157,200 |
| 2015 | $4,947 | $394,800 | $237,600 | $157,200 |
Map
- 106 Fort Hill St
- 14 Isaac Sprague Dr
- 156 Fort Hill St
- 1 Brewer Way
- 4 Quail Run
- 23 Del Prete Dr
- 77 Clinton Rd
- 196 South St Unit A
- 191 South St
- 198 South St Unit A
- 190 South St Unit A
- 246 North St
- 194-196 Hersey St
- 33 Volusia Rd
- 30 Manatee Rd
- 59 Elm St
- 51 Elm St
- 3 Hollyhock Ln
- 1905 Hockley Dr
- 3302 Tuckers Ln
- 7 Newbridge St
- 12 Newbridge St
- 12 Newbridge St Unit 1
- 8 Newbridge St
- 18 Newbridge St
- 4 Newbridge St
- 106 Fort Hill St
- 96 Fort Hill St
- 92 Fort Hill St
- 92 Fort Hill St Unit R
- 111 Fort Hill St
- 90 Fort Hill St
- 120 Fort Hill St
- 107 Fort Hill St
- 31 Newbridge St
- 117 Fort Hill St
- 103 Fort Hill St
- 2 Charles Everett Way
- 88 Fort Hill St
- 99 Fort Hill St
Ask me questions while you tour the home.