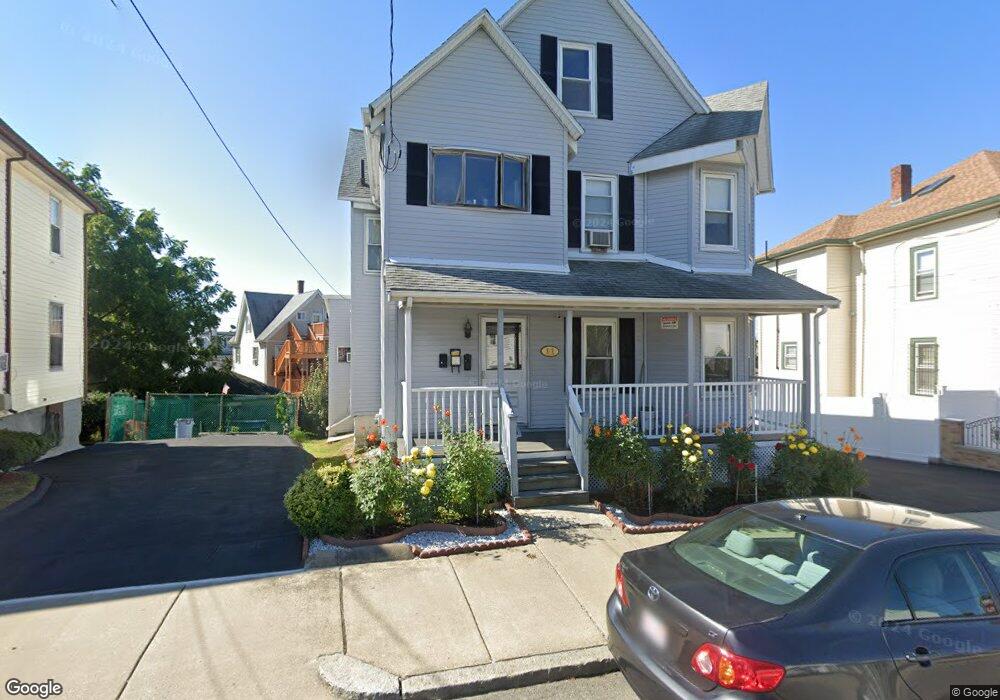
11 Newbury St Malden, MA 02148
Belmont NeighborhoodEstimated Value: $691,405 - $941,000
3
Beds
1
Bath
600
Sq Ft
$1,390/Sq Ft
Est. Value
About This Home
This home is located at 11 Newbury St, Malden, MA 02148 and is currently estimated at $834,101, approximately $1,390 per square foot. 11 Newbury St is a home located in Essex County with nearby schools including Malden High School, Pioneer Charter School of Science, and Cheverus Catholic School.
Ownership History
Date
Name
Owned For
Owner Type
Purchase Details
Closed on
Sep 10, 2021
Sold by
An Chi Q and An Trang T
Bought by
An Daniel Q
Current Estimated Value
Purchase Details
Closed on
May 1, 1992
Sold by
Monaco Francis J and Monaco Eileen
Bought by
An Chi Q and An Trang T
Home Financials for this Owner
Home Financials are based on the most recent Mortgage that was taken out on this home.
Original Mortgage
$120,000
Interest Rate
8.96%
Mortgage Type
Purchase Money Mortgage
Purchase Details
Closed on
Jun 21, 1989
Sold by
Monaco Francis J
Bought by
Monaco Francis J
Create a Home Valuation Report for This Property
The Home Valuation Report is an in-depth analysis detailing your home's value as well as a comparison with similar homes in the area
Home Values in the Area
Average Home Value in this Area
Purchase History
| Date | Buyer | Sale Price | Title Company |
|---|---|---|---|
| An Daniel Q | -- | None Available | |
| An Chi Q | $163,000 | -- | |
| Monaco Francis J | $55,000 | -- |
Source: Public Records
Mortgage History
| Date | Status | Borrower | Loan Amount |
|---|---|---|---|
| Previous Owner | Monaco Francis J | $120,000 |
Source: Public Records
Tax History Compared to Growth
Tax History
| Year | Tax Paid | Tax Assessment Tax Assessment Total Assessment is a certain percentage of the fair market value that is determined by local assessors to be the total taxable value of land and additions on the property. | Land | Improvement |
|---|---|---|---|---|
| 2025 | $85 | $750,300 | $304,700 | $445,600 |
| 2024 | $8,250 | $705,700 | $288,200 | $417,500 |
| 2023 | $7,970 | $653,800 | $263,500 | $390,300 |
| 2022 | $7,620 | $617,000 | $238,800 | $378,200 |
| 2021 | $7,330 | $596,400 | $218,200 | $378,200 |
| 2020 | $7,089 | $560,400 | $207,500 | $352,900 |
| 2019 | $6,908 | $520,600 | $197,600 | $323,000 |
| 2018 | $6,653 | $472,200 | $166,700 | $305,500 |
| 2017 | $6,494 | $458,300 | $166,700 | $291,600 |
| 2016 | $6,031 | $397,800 | $158,500 | $239,300 |
| 2015 | $5,842 | $371,400 | $149,500 | $221,900 |
| 2014 | $5,508 | $342,100 | $135,900 | $206,200 |
Source: Public Records
Map
Nearby Homes
- 55 Clarendon St
- 16 Woodville St
- 210 Hancock St
- 80 Main St Unit 9
- 58 Regent Rd
- 340 Main St
- 4 Cross St Unit 1
- 315 Main St
- 67 Converse Ave Unit 69
- 89 Judson St
- 171 Bell Rock St Unit 171
- 32 Central Ave
- 96 Clark St
- 21 Central Ave Unit 10
- 103 Swan St
- 81 Everett St
- 48 Cleveland Ave
- 21 Staples Ave Unit 25
- 15 Staples Ave Unit 31
- 100 Medford St
- 11 Newbury St
- 17 Newbury St
- 5 Newbury St
- 49 Appleton St
- 19 Newbury St
- 19 Newbury St Unit 1
- 36 Belmont St
- 40 Belmont St
- 40 Belmont St Unit 1
- 39 Appleton St
- 32 Belmont St
- 20 Newbury St
- 42 Belmont St
- 42 Belmont St Unit 2
- 42 Belmont St Unit 1
- 23 Newbury St
- 23 Newbury St Unit 1
- 28-30 Belmont St
- 28 Belmont St Unit 30
- 28 Belmont St Unit 1