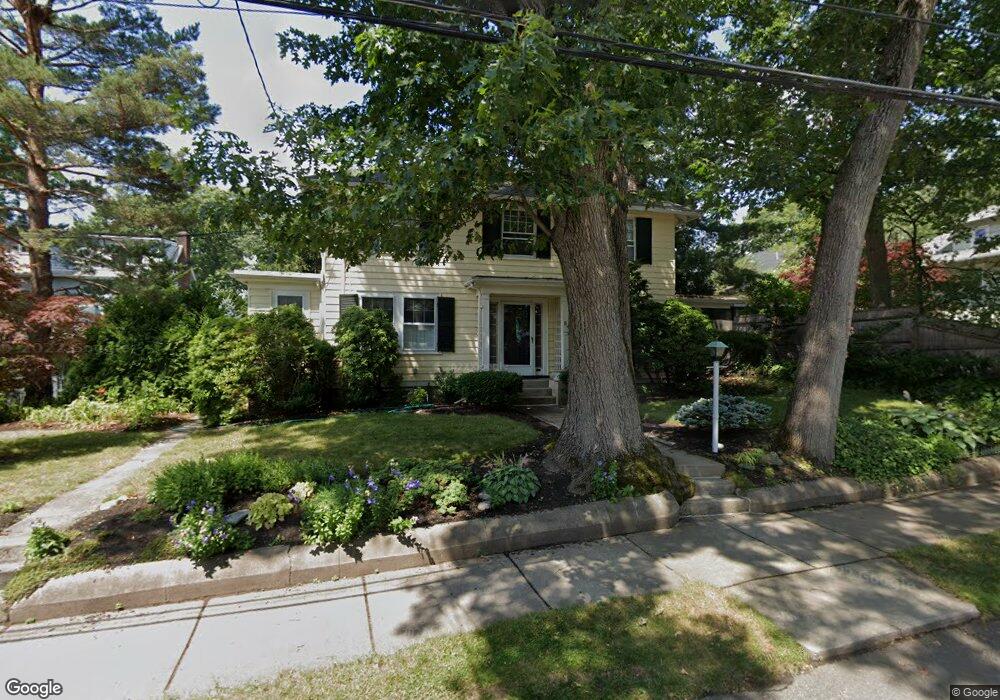
11 Newbury St Newton Center, MA 02459
Newton Centre NeighborhoodEstimated Value: $1,185,000 - $1,798,000
3
Beds
2
Baths
1,524
Sq Ft
$1,006/Sq Ft
Est. Value
About This Home
This home is located at 11 Newbury St, Newton Center, MA 02459 and is currently estimated at $1,533,378, approximately $1,006 per square foot. 11 Newbury St is a home located in Middlesex County with nearby schools including Mason Rice Elementary School, Charles E Brown Middle School, and Newton South High School.
Ownership History
Date
Name
Owned For
Owner Type
Purchase Details
Closed on
Jun 15, 1990
Sold by
Est Mary G Vachon
Bought by
Chiorazzi Michael G
Current Estimated Value
Home Financials for this Owner
Home Financials are based on the most recent Mortgage that was taken out on this home.
Original Mortgage
$185,000
Interest Rate
10.54%
Mortgage Type
Purchase Money Mortgage
Purchase Details
Closed on
Aug 2, 1989
Sold by
Starker Services
Bought by
Sharaf James A
Create a Home Valuation Report for This Property
The Home Valuation Report is an in-depth analysis detailing your home's value as well as a comparison with similar homes in the area
Home Values in the Area
Average Home Value in this Area
Purchase History
| Date | Buyer | Sale Price | Title Company |
|---|---|---|---|
| Chiorazzi Michael G | $210,000 | -- | |
| Sharaf James A | $280,000 | -- |
Source: Public Records
Mortgage History
| Date | Status | Borrower | Loan Amount |
|---|---|---|---|
| Closed | Sharaf James A | $185,000 | |
| Previous Owner | Sharaf James A | $25,000 |
Source: Public Records
Tax History Compared to Growth
Tax History
| Year | Tax Paid | Tax Assessment Tax Assessment Total Assessment is a certain percentage of the fair market value that is determined by local assessors to be the total taxable value of land and additions on the property. | Land | Improvement |
|---|---|---|---|---|
| 2025 | $11,068 | $1,129,400 | $982,100 | $147,300 |
| 2024 | $10,702 | $1,096,500 | $953,500 | $143,000 |
| 2023 | $10,194 | $1,001,400 | $728,700 | $272,700 |
| 2022 | $9,754 | $927,200 | $674,700 | $252,500 |
| 2021 | $9,412 | $874,700 | $636,500 | $238,200 |
| 2020 | $9,132 | $874,700 | $636,500 | $238,200 |
| 2019 | $8,874 | $849,200 | $618,000 | $231,200 |
| 2018 | $8,455 | $781,400 | $559,700 | $221,700 |
| 2017 | $8,198 | $737,200 | $528,000 | $209,200 |
| 2016 | $7,841 | $689,000 | $493,500 | $195,500 |
| 2015 | $7,476 | $643,900 | $461,200 | $182,700 |
Source: Public Records
Map
Nearby Homes
- 956 Walnut St Unit 4
- 956 Walnut St Unit 7
- 956 Walnut St Unit 6
- 54 Garland Rd
- 1114 Beacon St Unit 106
- 1114 Beacon St Unit 203
- 1114 Beacon St Unit 111
- 1114 Beacon St Unit 104
- 1114 Beacon St Unit 207
- 28 Wilson Cir Unit 28
- 32 Wilson Cir Unit 32
- 26 Wilson Cir Unit 26
- Lot 3 Chapin Rd
- Lot 2 Chapin Rd
- Lots 2 & 3 Chapin Rd
- 59 Charlotte Rd
- 2 Raeburn Terrace
- 1151 Walnut St Unit 205
- 1151 Walnut St Unit 405
- 1151 Walnut St Unit 207
- 12 Albion St
- 21 Newbury St
- 2 Newbury Terrace
- 16 Albion Place
- 24 Albion St
- 1016 Beacon St
- 20 Albion Place
- 3 Newbury Terrace
- 1022 Beacon St
- 3 Albion Place
- 6 Newbury Terrace
- 1008 Beacon St
- 7 Newbury Terrace
- 7 Newbury Terrace Unit 1
- 15 Albion St
- 10 Newbury Terrace
- 2 Albion Place
- 38 Newbury St
- 21 Albion St
- 1002 Beacon St