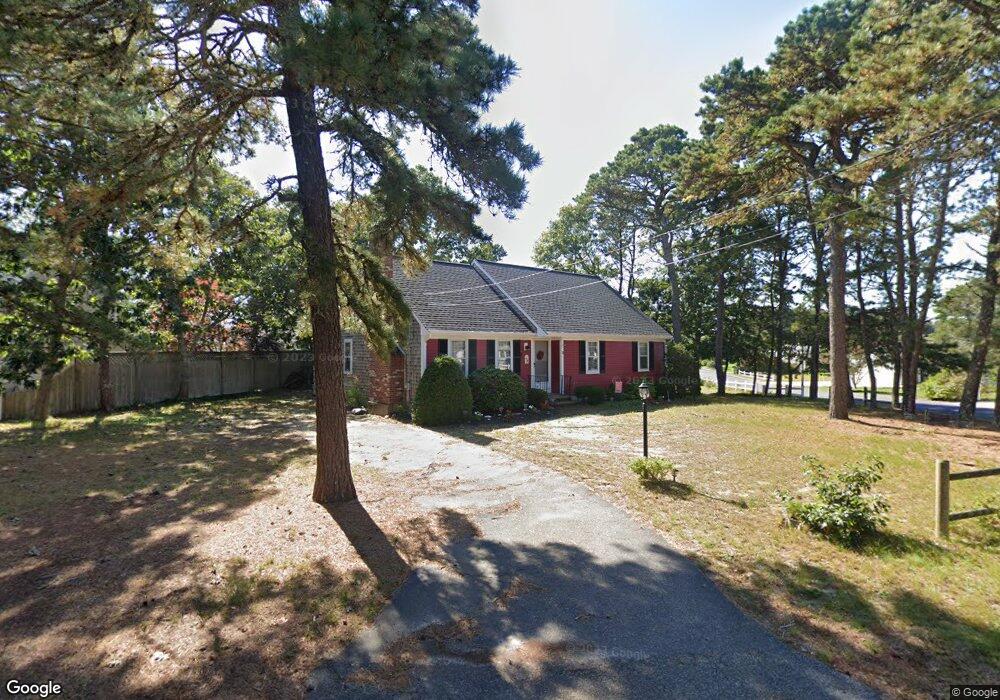
11 North Rd West Dennis, MA 02670
West Dennis NeighborhoodEstimated Value: $710,795 - $858,000
3
Beds
2
Baths
1,192
Sq Ft
$662/Sq Ft
Est. Value
About This Home
This home is located at 11 North Rd, West Dennis, MA 02670 and is currently estimated at $788,699, approximately $661 per square foot. 11 North Rd is a home located in Barnstable County with nearby schools including Dennis-Yarmouth Regional High School and St. Pius X. School.
Ownership History
Date
Name
Owned For
Owner Type
Purchase Details
Closed on
Jan 22, 2015
Sold by
Oconnell Patrick F
Bought by
Oconnell Ryan P
Current Estimated Value
Purchase Details
Closed on
Feb 21, 1992
Sold by
Donovan John W and Donovan Gale V
Bought by
Carroccia Michael E and Carroccia Margaret
Home Financials for this Owner
Home Financials are based on the most recent Mortgage that was taken out on this home.
Original Mortgage
$121,600
Interest Rate
8.19%
Mortgage Type
Purchase Money Mortgage
Create a Home Valuation Report for This Property
The Home Valuation Report is an in-depth analysis detailing your home's value as well as a comparison with similar homes in the area
Home Values in the Area
Average Home Value in this Area
Purchase History
| Date | Buyer | Sale Price | Title Company |
|---|---|---|---|
| Oconnell Ryan P | -- | -- | |
| Carroccia Michael E | $152,500 | -- |
Source: Public Records
Mortgage History
| Date | Status | Borrower | Loan Amount |
|---|---|---|---|
| Previous Owner | Carroccia Michael E | $121,600 |
Source: Public Records
Tax History Compared to Growth
Tax History
| Year | Tax Paid | Tax Assessment Tax Assessment Total Assessment is a certain percentage of the fair market value that is determined by local assessors to be the total taxable value of land and additions on the property. | Land | Improvement |
|---|---|---|---|---|
| 2025 | $2,806 | $648,100 | $271,100 | $377,000 |
| 2024 | $2,688 | $612,400 | $260,800 | $351,600 |
| 2023 | $2,590 | $554,600 | $230,500 | $324,100 |
| 2022 | $3,420 | $466,000 | $225,400 | $240,600 |
| 2021 | $2,553 | $423,400 | $221,000 | $202,400 |
| 2020 | $2,610 | $427,900 | $244,200 | $183,700 |
| 2019 | $2,880 | $336,900 | $171,000 | $165,900 |
| 2018 | $2,403 | $379,000 | $228,000 | $151,000 |
| 2017 | $2,506 | $320,000 | $173,700 | $146,300 |
| 2016 | $2,118 | $324,400 | $200,800 | $123,600 |
| 2015 | $2,076 | $324,400 | $200,800 | $123,600 |
| 2014 | $1,854 | $291,900 | $168,300 | $123,600 |
Source: Public Records
Map
Nearby Homes
- 2 Rita Mary Way
- 14 Schoolhouse Ln
- 209 Main St Unit 3
- 209 Main St Unit 6
- 209 Main St Unit 1
- 209 Main St Unit 2
- 209 Main St Unit 4
- 209 Main St Unit 5
- 178 School St
- 23 Doric Ave
- 308 Old Main St
- 401 Main St Unit 201
- 401 Main St Unit 101
- 45 Seth Ln
- 40 Kelley Rd
- 181 Pleasant St
- 467 Main St
- 428 Main St Unit 1-11
- 29 Bass River Rd
- 18 Turner Ln