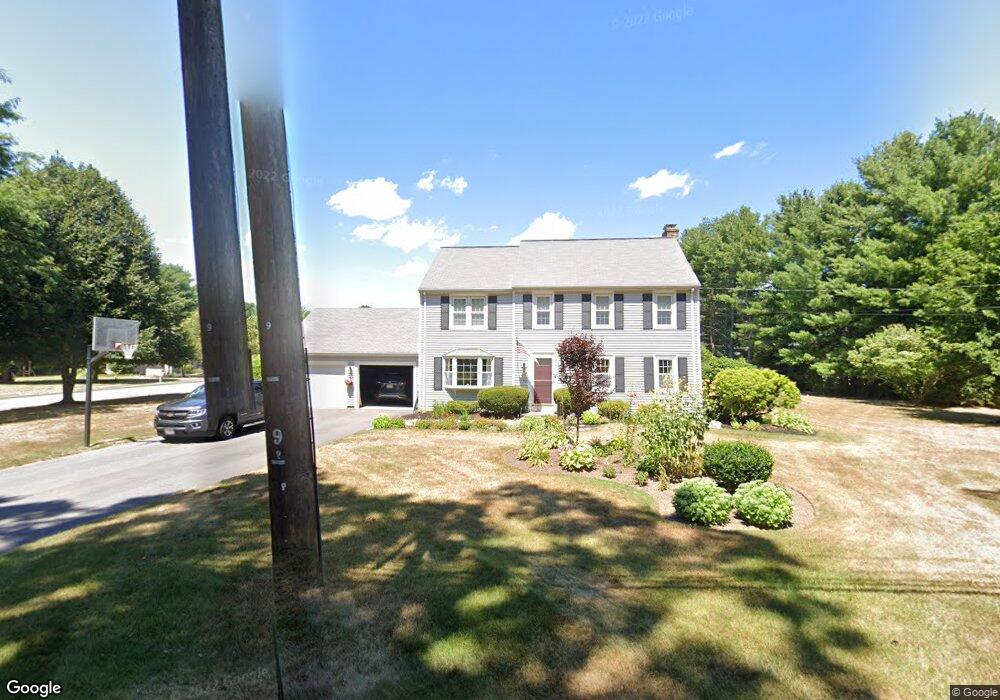
11 Old Nourse St Westborough, MA 01581
Estimated Value: $868,000 - $953,000
4
Beds
3
Baths
2,317
Sq Ft
$396/Sq Ft
Est. Value
About This Home
This home is located at 11 Old Nourse St, Westborough, MA 01581 and is currently estimated at $918,600, approximately $396 per square foot. 11 Old Nourse St is a home located in Worcester County with nearby schools including Westborough High School, Ebridge Montessori School, and Westboro Knowledge Beginnings.
Ownership History
Date
Name
Owned For
Owner Type
Purchase Details
Closed on
Jun 21, 2022
Sold by
Black Joseph T and Black Susan M
Bought by
Black Nt 2022 and Black
Current Estimated Value
Purchase Details
Closed on
Jan 23, 1992
Sold by
Manning Gordon S and Rothman Karen F
Bought by
Black Joseph T and Black Susan M
Create a Home Valuation Report for This Property
The Home Valuation Report is an in-depth analysis detailing your home's value as well as a comparison with similar homes in the area
Home Values in the Area
Average Home Value in this Area
Purchase History
| Date | Buyer | Sale Price | Title Company |
|---|---|---|---|
| Black Nt 2022 | -- | None Available | |
| Black Joseph T | $209,000 | -- |
Source: Public Records
Mortgage History
| Date | Status | Borrower | Loan Amount |
|---|---|---|---|
| Previous Owner | Black Joseph T | $260,000 | |
| Previous Owner | Black Joseph T | $210,000 | |
| Previous Owner | Black Joseph T | $195,000 |
Source: Public Records
Tax History Compared to Growth
Tax History
| Year | Tax Paid | Tax Assessment Tax Assessment Total Assessment is a certain percentage of the fair market value that is determined by local assessors to be the total taxable value of land and additions on the property. | Land | Improvement |
|---|---|---|---|---|
| 2025 | $11,950 | $733,600 | $338,500 | $395,100 |
| 2024 | $11,508 | $701,300 | $322,200 | $379,100 |
| 2023 | $10,762 | $639,100 | $303,800 | $335,300 |
| 2022 | $10,145 | $548,700 | $252,800 | $295,900 |
| 2021 | $9,379 | $505,900 | $210,000 | $295,900 |
| 2020 | $9,100 | $496,700 | $208,000 | $288,700 |
| 2019 | $8,941 | $487,800 | $218,200 | $269,600 |
| 2018 | $8,373 | $453,600 | $208,000 | $245,600 |
| 2017 | $8,074 | $453,600 | $208,000 | $245,600 |
| 2016 | $7,949 | $447,300 | $203,900 | $243,400 |
| 2015 | $7,810 | $420,100 | $191,700 | $228,400 |
Source: Public Records
Map
Nearby Homes