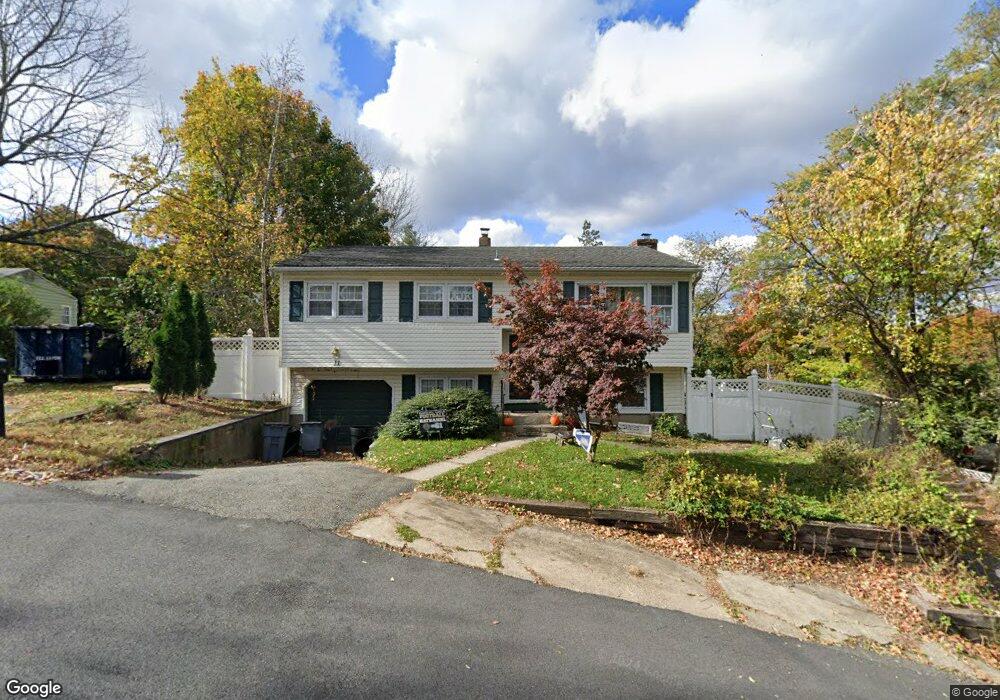
11 Oliver Rd Landing, NJ 07850
Estimated Value: $459,571 - $580,000
Studio
--
Bath
1,552
Sq Ft
$325/Sq Ft
Est. Value
About This Home
This home is located at 11 Oliver Rd, Landing, NJ 07850 and is currently estimated at $504,143, approximately $324 per square foot. 11 Oliver Rd is a home located in Morris County with nearby schools including Eisenhower Middle School, Lincoln Roosevelt Elementary School, and Roxbury High School.
Ownership History
Date
Name
Owned For
Owner Type
Purchase Details
Closed on
Jun 29, 2006
Sold by
Henery Jason
Bought by
Kay Jeffery and Kay Shannon
Current Estimated Value
Home Financials for this Owner
Home Financials are based on the most recent Mortgage that was taken out on this home.
Original Mortgage
$33,850
Interest Rate
6.27%
Mortgage Type
Stand Alone Second
Purchase Details
Closed on
Sep 30, 2003
Sold by
Milling Andrew
Bought by
Henery Jason and Henery Melanie
Purchase Details
Closed on
May 2, 2003
Sold by
Cordero Betsy
Bought by
Milling Andrew and Milling Kim
Home Financials for this Owner
Home Financials are based on the most recent Mortgage that was taken out on this home.
Original Mortgage
$134,100
Interest Rate
5.86%
Purchase Details
Closed on
Jul 26, 1995
Sold by
Long Donna A
Bought by
Cordero Betsy A
Create a Home Valuation Report for This Property
The Home Valuation Report is an in-depth analysis detailing your home's value as well as a comparison with similar homes in the area
Home Values in the Area
Average Home Value in this Area
Purchase History
| Date | Buyer | Sale Price | Title Company |
|---|---|---|---|
| Kay Jeffery | $342,000 | -- | |
| Henery Jason | $285,000 | -- | |
| Milling Andrew | $149,000 | -- | |
| Cordero Betsy A | $137,000 | -- |
Source: Public Records
Mortgage History
| Date | Status | Borrower | Loan Amount |
|---|---|---|---|
| Closed | Kay Jeffery | $33,850 | |
| Open | Kay Jeffery | $273,600 | |
| Previous Owner | Milling Andrew | $134,100 |
Source: Public Records
Tax History
| Year | Tax Paid | Tax Assessment Tax Assessment Total Assessment is a certain percentage of the fair market value that is determined by local assessors to be the total taxable value of land and additions on the property. | Land | Improvement |
|---|---|---|---|---|
| 2025 | $6,818 | $248,000 | $80,500 | $167,500 |
| 2024 | $6,711 | $248,000 | $80,500 | $167,500 |
Source: Public Records
Map
Nearby Homes
- 21 Laurie Rd
- 512 Colver Rd
- 27 Condict Rd
- 517 Vail Rd
- 510 Davsel Rd
- 38 Silver Springs Dr
- 305 Kingsland Rd
- 12 Ford Rd
- 625 E Vail Rd
- 627 E Vail Rd
- 592 Dell Rd
- 603 Bensel Dr
- 625 Succasunna Rd
- 181 Orben Dr
- 25 Sycamore Way
- 48 Hickory Way Unit 4001
- 20 Sycamore Way Unit 106
- 76 Hickory Way Unit 6003
- 38 Spruce Terrace Unit 4832
- 30 Hickory Way
Your Personal Tour Guide
Ask me questions while you tour the home.