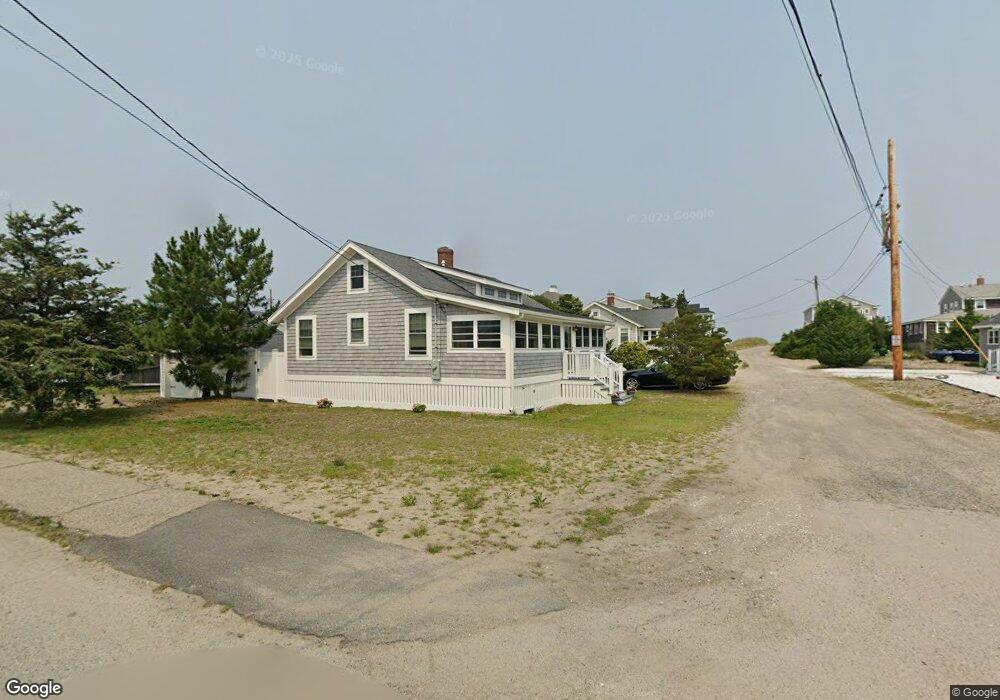
11 Oliver St Scituate, MA 02066
Humarock NeighborhoodEstimated Value: $849,000 - $1,051,000
3
Beds
1
Bath
1,152
Sq Ft
$847/Sq Ft
Est. Value
About This Home
This home is located at 11 Oliver St, Scituate, MA 02066 and is currently estimated at $975,771, approximately $847 per square foot. 11 Oliver St is a home.
Ownership History
Date
Name
Owned For
Owner Type
Purchase Details
Closed on
Jun 11, 2020
Sold by
Mckay James J and Mckay Victoria W
Bought by
James J Mckay T
Current Estimated Value
Purchase Details
Closed on
Jul 20, 2012
Sold by
Lamb Cecelia L
Bought by
Mckay James J and Mckay Victoria W
Home Financials for this Owner
Home Financials are based on the most recent Mortgage that was taken out on this home.
Original Mortgage
$288,000
Interest Rate
3.7%
Mortgage Type
New Conventional
Create a Home Valuation Report for This Property
The Home Valuation Report is an in-depth analysis detailing your home's value as well as a comparison with similar homes in the area
Home Values in the Area
Average Home Value in this Area
Purchase History
| Date | Buyer | Sale Price | Title Company |
|---|---|---|---|
| James J Mckay T | -- | None Available | |
| Mckay James J | $429,900 | -- |
Source: Public Records
Mortgage History
| Date | Status | Borrower | Loan Amount |
|---|---|---|---|
| Previous Owner | Mckay James J | $288,000 |
Source: Public Records
Tax History
| Year | Tax Paid | Tax Assessment Tax Assessment Total Assessment is a certain percentage of the fair market value that is determined by local assessors to be the total taxable value of land and additions on the property. | Land | Improvement |
|---|---|---|---|---|
| 2025 | $6,939 | $694,600 | $524,600 | $170,000 |
| 2024 | $6,204 | $598,800 | $441,600 | $157,200 |
| 2023 | $5,736 | $541,700 | $401,500 | $140,200 |
| 2022 | $5,736 | $454,500 | $330,900 | $123,600 |
| 2021 | $5,587 | $419,100 | $315,100 | $104,000 |
| 2020 | $5,612 | $415,700 | $315,100 | $100,600 |
| 2019 | $5,552 | $404,100 | $308,900 | $95,200 |
| 2018 | $5,569 | $399,200 | $313,500 | $85,700 |
| 2017 | $5,482 | $389,100 | $303,400 | $85,700 |
| 2016 | $4,931 | $348,700 | $263,000 | $85,700 |
| 2015 | $4,568 | $348,700 | $263,000 | $85,700 |
Source: Public Records
Map
Nearby Homes
- 255 Ridge Rd
- 566 Holly Rd
- 4 Summer St
- 3 Summer St
- 29 Spyglass Landing Dr
- 16 Schooner Way
- 39 High Beacon Way
- 155 Quincy Ave
- 38 Winthrop Dr
- 85 Constitution Rd
- 76 Macombers Way
- 55 Macombers Way
- 480 Pleasant St
- 92 Salt Meadow Waye
- 1155 Main St
- 30 Chandler Dr
- 290 S River St
- 32 Gratto Rd
- 7 Pierce Rd
- 235 Main St
Your Personal Tour Guide
Ask me questions while you tour the home.