Estimated Value: $822,000 - $1,219,000
3
Beds
3
Baths
2,383
Sq Ft
$401/Sq Ft
Est. Value
About This Home
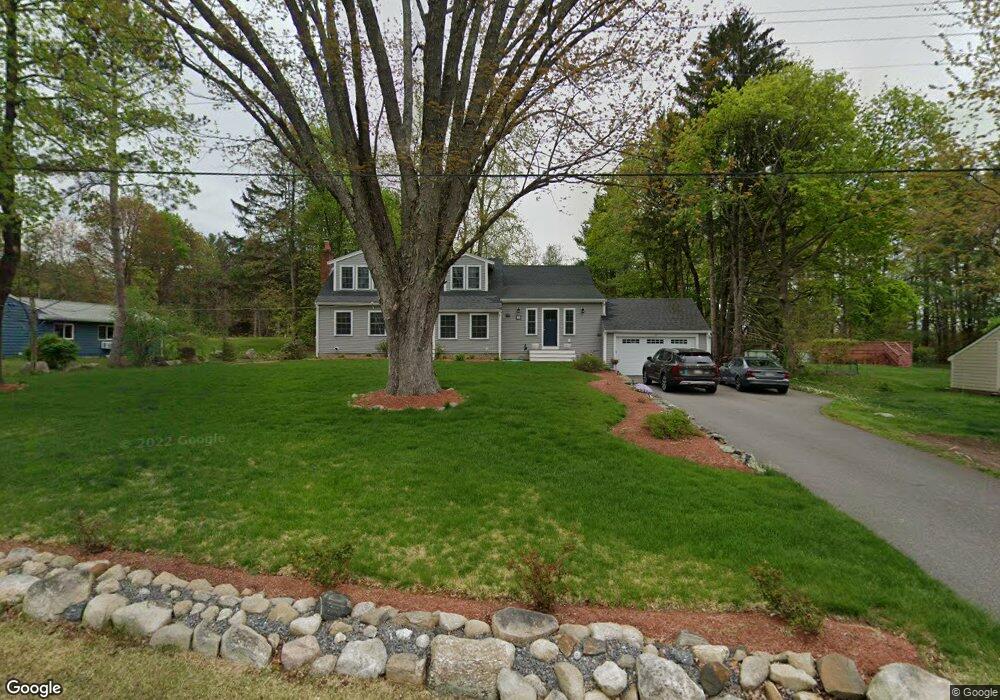
This home is located at 11 Orchard Dr, Acton, MA 01720 and is currently estimated at $956,672, approximately $401 per square foot. 11 Orchard Dr is a home located in Middlesex County with nearby schools including Acton-Boxborough Regional High School and Oak Meadow Montessori School.
Ownership History
Date
Name
Owned For
Owner Type
Purchase Details
Closed on
Mar 26, 2002
Sold by
Koyce Brian G and Koyce Jennifer S
Bought by
Shamah Steven M and Shamah Kimberly D
Current Estimated Value
Purchase Details
Closed on
Jul 24, 1998
Sold by
Harris Scott S and Harris Jody L
Bought by
Koyce Brian G and Koyce Jennifer S
Create a Home Valuation Report for This Property
The Home Valuation Report is an in-depth analysis detailing your home's value as well as a comparison with similar homes in the area
Home Values in the Area
Average Home Value in this Area
Purchase History
| Date | Buyer | Sale Price | Title Company |
|---|---|---|---|
| Shamah Steven M | $365,000 | -- | |
| Koyce Brian G | $242,000 | -- |
Source: Public Records
Mortgage History
| Date | Status | Borrower | Loan Amount |
|---|---|---|---|
| Open | Koyce Brian G | $340,000 | |
| Closed | Koyce Brian G | $348,800 |
Source: Public Records
Tax History Compared to Growth
Tax History
| Year | Tax Paid | Tax Assessment Tax Assessment Total Assessment is a certain percentage of the fair market value that is determined by local assessors to be the total taxable value of land and additions on the property. | Land | Improvement |
|---|---|---|---|---|
| 2025 | $15,113 | $881,200 | $328,800 | $552,400 |
| 2024 | $14,223 | $853,200 | $328,800 | $524,400 |
| 2023 | $14,445 | $822,600 | $298,200 | $524,400 |
| 2022 | $12,965 | $666,600 | $259,900 | $406,700 |
| 2021 | $12,692 | $627,400 | $240,300 | $387,100 |
| 2020 | $11,686 | $607,400 | $240,300 | $367,100 |
| 2019 | $11,176 | $577,000 | $240,300 | $336,700 |
| 2018 | $7,814 | $403,200 | $240,300 | $162,900 |
| 2017 | $8,184 | $429,400 | $240,300 | $189,100 |
| 2016 | $7,850 | $408,200 | $240,300 | $167,900 |
| 2015 | $7,542 | $395,900 | $240,300 | $155,600 |
| 2014 | $7,521 | $386,700 | $240,300 | $146,400 |
Source: Public Records
Map
Nearby Homes
- 31 Mohawk Dr
- 9 Elm St Unit 1
- 5 Elm St Unit 1
- 4 Huron Rd
- 285 Central St Unit 285
- 68 Macintosh Ln
- 134 Russet Ln
- 89 Windsor Ave
- 92 Willow St Unit 3
- 92 Willow St Unit 2
- 90 Willow St Unit 1
- 4,7,8 Crestwood Ln
- 777 Depot Rd
- 4 Omega Way
- 96 Cedarwood Rd
- 62 Waite Rd
- 12 Olde Lantern Rd
- 3 Heather Hill Rd
- 23 John Swift Rd
- 169 Main St