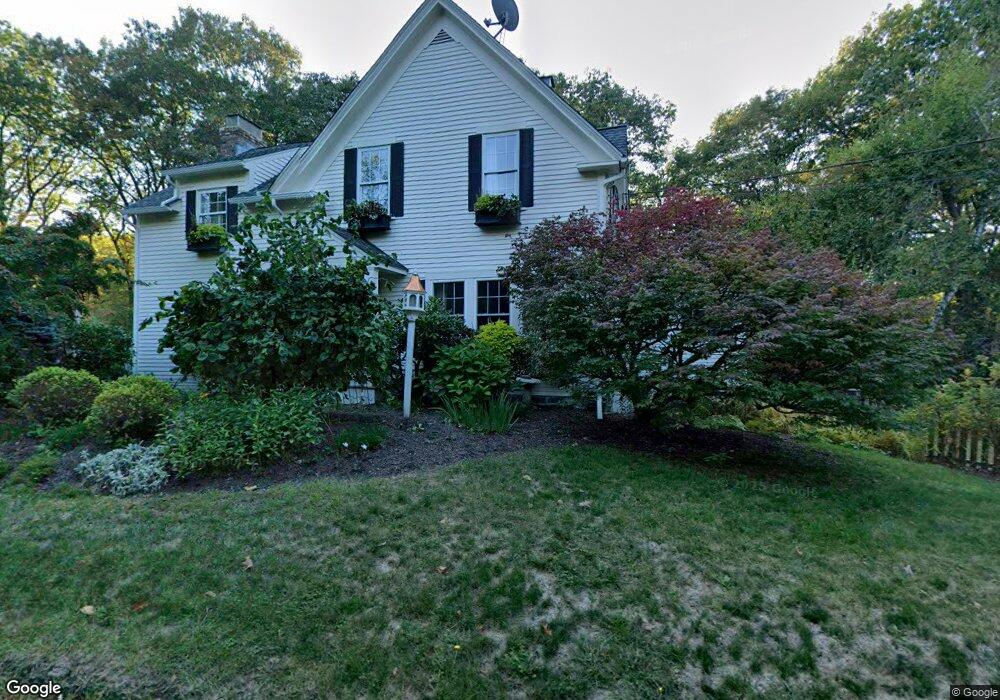
11 Osgood Rd Princeton, MA 01541
Estimated Value: $592,574 - $747,000
3
Beds
2
Baths
2,386
Sq Ft
$287/Sq Ft
Est. Value
About This Home
This home is located at 11 Osgood Rd, Princeton, MA 01541 and is currently estimated at $684,144, approximately $286 per square foot. 11 Osgood Rd is a home located in Worcester County with nearby schools including Wachusett Regional High School.
Ownership History
Date
Name
Owned For
Owner Type
Purchase Details
Closed on
Jul 30, 2003
Sold by
Sasso Vincent T
Bought by
Burnham-Howard Corey E and Howard Michael D
Current Estimated Value
Home Financials for this Owner
Home Financials are based on the most recent Mortgage that was taken out on this home.
Original Mortgage
$271,920
Outstanding Balance
$116,774
Interest Rate
5.28%
Mortgage Type
Purchase Money Mortgage
Estimated Equity
$567,370
Purchase Details
Closed on
Oct 22, 1996
Sold by
Mcguirk Jane C
Bought by
Sasso Vincent and Sasso Linda
Home Financials for this Owner
Home Financials are based on the most recent Mortgage that was taken out on this home.
Original Mortgage
$176,700
Interest Rate
8.26%
Mortgage Type
Purchase Money Mortgage
Purchase Details
Closed on
Aug 16, 1993
Sold by
Crowley Carolyn E
Bought by
Mcguirk Jane C
Home Financials for this Owner
Home Financials are based on the most recent Mortgage that was taken out on this home.
Original Mortgage
$135,200
Interest Rate
7.16%
Mortgage Type
Purchase Money Mortgage
Create a Home Valuation Report for This Property
The Home Valuation Report is an in-depth analysis detailing your home's value as well as a comparison with similar homes in the area
Home Values in the Area
Average Home Value in this Area
Purchase History
| Date | Buyer | Sale Price | Title Company |
|---|---|---|---|
| Burnham-Howard Corey E | $339,900 | -- | |
| Sasso Vincent | $186,500 | -- | |
| Mcguirk Jane C | $169,000 | -- |
Source: Public Records
Mortgage History
| Date | Status | Borrower | Loan Amount |
|---|---|---|---|
| Open | Burnham-Howard Corey E | $271,920 | |
| Previous Owner | Mcguirk Jane C | $40,000 | |
| Previous Owner | Mcguirk Jane C | $176,700 | |
| Previous Owner | Mcguirk Jane C | $135,200 |
Source: Public Records
Tax History Compared to Growth
Tax History
| Year | Tax Paid | Tax Assessment Tax Assessment Total Assessment is a certain percentage of the fair market value that is determined by local assessors to be the total taxable value of land and additions on the property. | Land | Improvement |
|---|---|---|---|---|
| 2025 | $7,092 | $488,100 | $128,900 | $359,200 |
| 2024 | $7,029 | $501,000 | $128,900 | $372,100 |
| 2023 | $6,666 | $440,300 | $102,700 | $337,600 |
| 2022 | $6,365 | $405,900 | $102,700 | $303,200 |
| 2021 | $5,974 | $370,600 | $102,700 | $267,900 |
| 2020 | $5,785 | $365,000 | $102,700 | $262,300 |
| 2019 | $5,490 | $342,700 | $100,100 | $242,600 |
| 2018 | $5,220 | $302,100 | $91,400 | $210,700 |
| 2017 | $923 | $299,200 | $135,900 | $163,300 |
| 2016 | $5,326 | $299,200 | $135,900 | $163,300 |
| 2015 | $5,192 | $300,100 | $133,500 | $166,600 |
Source: Public Records
Map
Nearby Homes
- 47 Pine Hill Rd
- 46 Pine Hill Rd
- 20 Wachusett Dr
- 161 Beaman Rd
- 3 Woods Rd
- 62 Bolton Rd Unit Oakmont
- 62 Bolton Rd Unit Applewood
- 169 Narrows Rd
- 5 Linda Dr Unit The Connor
- 82 Narrows Rd
- 21 Davis Rd
- 240-Lot 2 Davis Rd
- 1180 Elm St Unit Applewood
- 1180 Elm St Unit Willow
- 1170 Elm St Unit Wachusett
- 134 Mountain Rd
- 193 Justice Hill Road Cutoff
- 58 Merriam Rd
- 11 Mirick Rd
- 0 Minott Rd
- 239 Redemption Rock Trail N
- 7 Osgood Rd
- 369 Mirick Rd
- 3 Osgood Rd
- E Houghton Rd
- 366 Mirick Rd
- 12 Laurel Ridge Rd
- 357 Mirick Rd
- 249 Redemption Rock Trail N
- 362 Mirick Rd
- 362 Mirick Rd Unit 1
- 14 Redemption Rock Trail N
- 6 Laurel Ln
- 1 Laurel Ln
- 10 Laurel Ln
- 5 Laurel Ln
- 14 Laurel Ln
- 15 Rocky Pond Rd
- 16 Laurel Ridge Rd
- 352 Mirick Rd