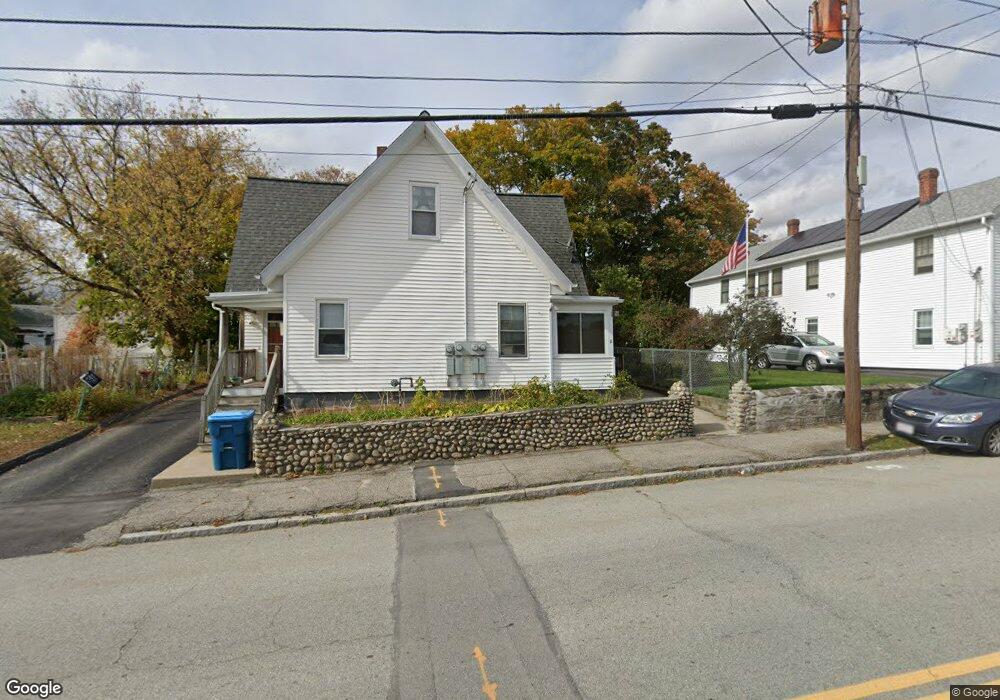
11 Oxford Ave Dudley, MA 01571
Estimated Value: $372,000 - $476,000
4
Beds
3
Baths
2,348
Sq Ft
$177/Sq Ft
Est. Value
About This Home
This home is located at 11 Oxford Ave, Dudley, MA 01571 and is currently estimated at $414,667, approximately $176 per square foot. 11 Oxford Ave is a home located in Worcester County with nearby schools including Shepherd Hill Regional High School, All Saints Academy, and St Joseph School.
Ownership History
Date
Name
Owned For
Owner Type
Purchase Details
Closed on
Feb 14, 2008
Sold by
Smith Brad J and Hometown Bk
Bought by
Smith Bennett J and Smith Carol H
Current Estimated Value
Home Financials for this Owner
Home Financials are based on the most recent Mortgage that was taken out on this home.
Original Mortgage
$340,000
Outstanding Balance
$215,358
Interest Rate
6.14%
Mortgage Type
Purchase Money Mortgage
Estimated Equity
$199,309
Purchase Details
Closed on
Apr 26, 2006
Sold by
Smith Brad J
Bought by
Bjs Ljc Prop Llc
Home Financials for this Owner
Home Financials are based on the most recent Mortgage that was taken out on this home.
Original Mortgage
$71,000
Interest Rate
6.4%
Mortgage Type
Purchase Money Mortgage
Purchase Details
Closed on
Oct 27, 1994
Sold by
Shaw Maryann
Bought by
Smith Brad J
Create a Home Valuation Report for This Property
The Home Valuation Report is an in-depth analysis detailing your home's value as well as a comparison with similar homes in the area
Home Values in the Area
Average Home Value in this Area
Purchase History
| Date | Buyer | Sale Price | Title Company |
|---|---|---|---|
| Smith Bennett J | $120,000 | -- | |
| Bjs Ljc Prop Llc | -- | -- | |
| Smith Brad J | $27,000 | -- |
Source: Public Records
Mortgage History
| Date | Status | Borrower | Loan Amount |
|---|---|---|---|
| Open | Smith Bennett J | $340,000 | |
| Previous Owner | Bjs Ljc Prop Llc | $71,000 | |
| Previous Owner | Smith Brad J | $10,000 | |
| Previous Owner | Smith Brad J | $70,000 | |
| Previous Owner | Smith Brad J | $35,000 | |
| Previous Owner | Smith Brad J | $15,000 |
Source: Public Records
Tax History
| Year | Tax Paid | Tax Assessment Tax Assessment Total Assessment is a certain percentage of the fair market value that is determined by local assessors to be the total taxable value of land and additions on the property. | Land | Improvement |
|---|---|---|---|---|
| 2025 | $34 | $321,800 | $63,900 | $257,900 |
| 2024 | $3,248 | $309,900 | $60,500 | $249,400 |
| 2023 | $3,140 | $309,100 | $55,900 | $253,200 |
| 2022 | $2,491 | $212,900 | $49,000 | $163,900 |
| 2021 | $2,287 | $185,900 | $45,600 | $140,300 |
| 2020 | $2,158 | $165,200 | $42,200 | $123,000 |
| 2019 | $156 | $165,200 | $42,200 | $123,000 |
| 2018 | $1,864 | $158,900 | $42,200 | $116,700 |
| 2017 | $1,764 | $147,700 | $42,200 | $105,500 |
| 2016 | $1,890 | $155,200 | $40,200 | $115,000 |
| 2015 | $1,873 | $152,800 | $37,800 | $115,000 |
Source: Public Records
Map
Nearby Homes
Your Personal Tour Guide
Ask me questions while you tour the home.