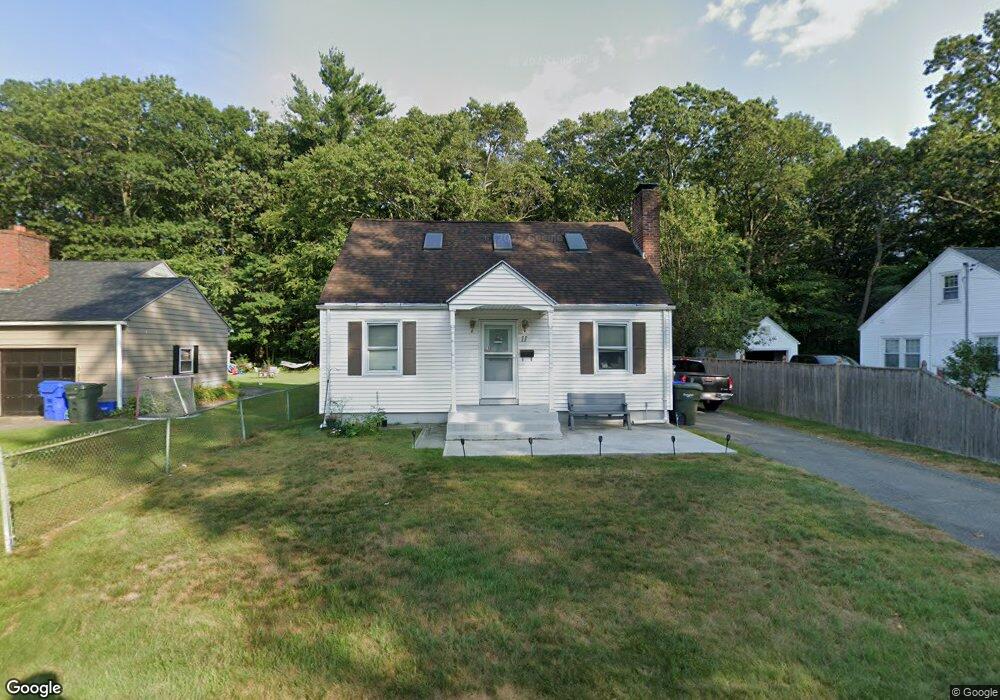
11 Park Rd Springfield, MA 01104
Liberty Heights NeighborhoodEstimated Value: $307,000 - $325,000
2
Beds
2
Baths
1,591
Sq Ft
$198/Sq Ft
Est. Value
About This Home
This home is located at 11 Park Rd, Springfield, MA 01104 and is currently estimated at $315,781, approximately $198 per square foot. 11 Park Rd is a home located in Hampden County with nearby schools including Glenwood School, Van Sickle Academy, and High School Of Commerce.
Ownership History
Date
Name
Owned For
Owner Type
Purchase Details
Closed on
Jun 14, 2018
Sold by
Webber David K
Bought by
Miner James D and Miner Dale B
Current Estimated Value
Purchase Details
Closed on
Apr 30, 1982
Bought by
Fleury James F and Fleury Gaynell E
Create a Home Valuation Report for This Property
The Home Valuation Report is an in-depth analysis detailing your home's value as well as a comparison with similar homes in the area
Home Values in the Area
Average Home Value in this Area
Purchase History
| Date | Buyer | Sale Price | Title Company |
|---|---|---|---|
| Miner James D | -- | -- | |
| Webber David K | -- | -- | |
| Miner James D | -- | -- | |
| Fleury James F | $43,000 | -- |
Source: Public Records
Mortgage History
| Date | Status | Borrower | Loan Amount |
|---|---|---|---|
| Previous Owner | Fleury James F | $77,250 | |
| Previous Owner | Fleury James F | $72,000 | |
| Previous Owner | Fleury James F | $30,000 | |
| Previous Owner | Fleury James F | $33,000 |
Source: Public Records
Tax History
| Year | Tax Paid | Tax Assessment Tax Assessment Total Assessment is a certain percentage of the fair market value that is determined by local assessors to be the total taxable value of land and additions on the property. | Land | Improvement |
|---|---|---|---|---|
| 2025 | $4,746 | $302,700 | $38,800 | $263,900 |
| 2024 | $4,171 | $259,700 | $38,800 | $220,900 |
| 2023 | $3,918 | $229,800 | $34,400 | $195,400 |
| 2022 | $3,645 | $193,700 | $32,100 | $161,600 |
| 2021 | $3,483 | $184,300 | $29,200 | $155,100 |
| 2020 | $3,478 | $178,100 | $29,200 | $148,900 |
| 2019 | $3,194 | $162,300 | $31,800 | $130,500 |
| 2018 | $3,267 | $166,000 | $31,800 | $134,200 |
| 2017 | $3,132 | $159,300 | $28,700 | $130,600 |
| 2016 | $3,012 | $153,200 | $27,200 | $126,000 |
| 2015 | $2,901 | $147,500 | $27,200 | $120,300 |
Source: Public Records
Map
Nearby Homes
- 103 Ontario St
- 1078 Liberty St
- 118 Wait St
- 491-493 Newbury St
- 744-746 Carew St
- 708-710 Carew St
- 774-776 Liberty St
- 2 Marion St
- Lot 1 Marion St
- 211-213 Chapin Terrace
- 571-573 Carew St
- 27 Parallel St
- 24 Melha Ave
- 119 Littleton St
- 59 Piedmont St
- 151 Littleton St
- 57- 59 Stearns Terrace
- 57 Narragansett St
- 9 Utica St
- 196 Massasoit St
Your Personal Tour Guide
Ask me questions while you tour the home.