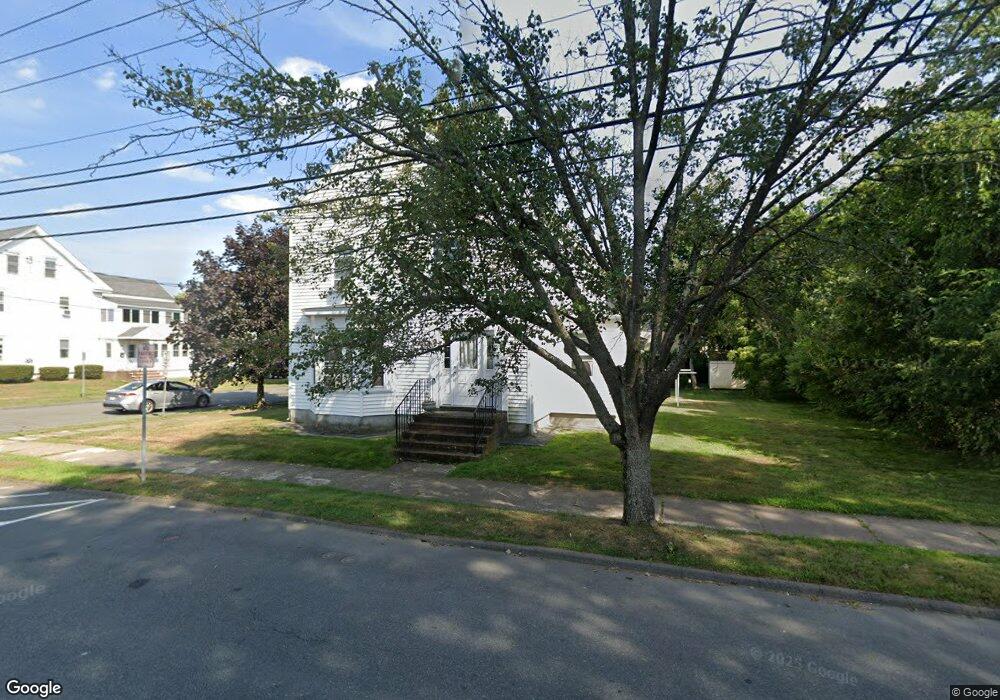
11 Park St Danvers, MA 01923
Estimated Value: $487,000 - $880,000
6
Beds
2
Baths
3,018
Sq Ft
$251/Sq Ft
Est. Value
About This Home
This home is located at 11 Park St, Danvers, MA 01923 and is currently estimated at $757,961, approximately $251 per square foot. 11 Park St is a home located in Essex County with nearby schools including Danvers High School, St. Mary of the Annunciation School, and St. John's Prep.
Ownership History
Date
Name
Owned For
Owner Type
Purchase Details
Closed on
Nov 17, 2020
Sold by
Branca Sean and Caputo Angela
Bought by
Keller Samuel and Keller Jaye
Current Estimated Value
Home Financials for this Owner
Home Financials are based on the most recent Mortgage that was taken out on this home.
Original Mortgage
$470,700
Outstanding Balance
$416,940
Interest Rate
2.8%
Mortgage Type
New Conventional
Estimated Equity
$341,021
Create a Home Valuation Report for This Property
The Home Valuation Report is an in-depth analysis detailing your home's value as well as a comparison with similar homes in the area
Home Values in the Area
Average Home Value in this Area
Purchase History
| Date | Buyer | Sale Price | Title Company |
|---|---|---|---|
| Keller Samuel | $563,000 | None Available |
Source: Public Records
Mortgage History
| Date | Status | Borrower | Loan Amount |
|---|---|---|---|
| Open | Keller Samuel | $470,700 |
Source: Public Records
Tax History Compared to Growth
Tax History
| Year | Tax Paid | Tax Assessment Tax Assessment Total Assessment is a certain percentage of the fair market value that is determined by local assessors to be the total taxable value of land and additions on the property. | Land | Improvement |
|---|---|---|---|---|
| 2025 | $8,480 | $771,600 | $346,100 | $425,500 |
| 2024 | $8,056 | $725,100 | $334,100 | $391,000 |
| 2023 | $8,044 | $684,600 | $301,900 | $382,700 |
| 2022 | $7,572 | $598,100 | $274,500 | $323,600 |
| 2021 | $7,413 | $555,300 | $261,300 | $294,000 |
| 2020 | $8,238 | $630,800 | $261,300 | $369,500 |
| 2019 | $6,611 | $497,800 | $226,700 | $271,100 |
| 2018 | $6,457 | $476,900 | $226,700 | $250,200 |
| 2017 | $6,044 | $425,900 | $206,400 | $219,500 |
| 2016 | $5,913 | $416,400 | $196,900 | $219,500 |
| 2015 | $5,790 | $388,300 | $173,000 | $215,300 |
Source: Public Records
Map
Nearby Homes
- 35 High St Unit 3D
- 38 High St Unit 4
- 12 Central Ave Unit 1
- 14 Williams St Unit C17
- 11 Riverside Ave Unit 111
- 35 Bayview Terrace Unit 7
- 4 Butler Ave
- 7 Riverbank Ave Unit 7
- 7 Riverbank Ave
- 35 Locust St Unit 3
- 63 Adams St
- 108 Abington Rd Unit 108
- 6 Kimberly Dr
- 57 Adams St
- 97 Sylvan St Unit 7
- 42 Coolidge Rd
- 6 Bartlett Rd
- 22 Collins St Unit 31
- 152 Endicott St
- 76 Water St