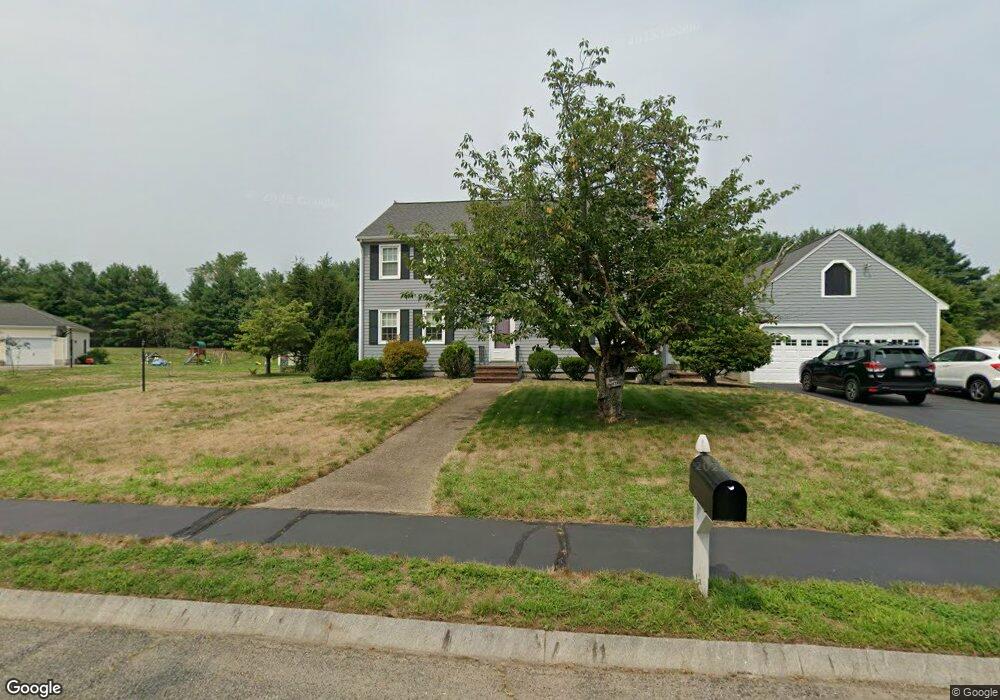
11 Partridge Ln Mansfield, MA 02048
Estimated Value: $754,228 - $899,000
4
Beds
3
Baths
2,128
Sq Ft
$382/Sq Ft
Est. Value
About This Home
This home is located at 11 Partridge Ln, Mansfield, MA 02048 and is currently estimated at $813,557, approximately $382 per square foot. 11 Partridge Ln is a home located in Bristol County with nearby schools including Everett W. Robinson Elementary School, Jordan/Jackson Elementary School, and Harold L. Qualters Middle School.
Ownership History
Date
Name
Owned For
Owner Type
Purchase Details
Closed on
Sep 24, 2007
Sold by
Hunt Philip M and Hunt Donna M
Bought by
Desimone Gaetano D and Desimone Lisa M
Current Estimated Value
Home Financials for this Owner
Home Financials are based on the most recent Mortgage that was taken out on this home.
Original Mortgage
$302,500
Outstanding Balance
$192,111
Interest Rate
6.63%
Mortgage Type
Purchase Money Mortgage
Estimated Equity
$621,446
Create a Home Valuation Report for This Property
The Home Valuation Report is an in-depth analysis detailing your home's value as well as a comparison with similar homes in the area
Home Values in the Area
Average Home Value in this Area
Purchase History
| Date | Buyer | Sale Price | Title Company |
|---|---|---|---|
| Desimone Gaetano D | $482,500 | -- |
Source: Public Records
Mortgage History
| Date | Status | Borrower | Loan Amount |
|---|---|---|---|
| Open | Desimone Gaetano D | $302,500 |
Source: Public Records
Tax History Compared to Growth
Tax History
| Year | Tax Paid | Tax Assessment Tax Assessment Total Assessment is a certain percentage of the fair market value that is determined by local assessors to be the total taxable value of land and additions on the property. | Land | Improvement |
|---|---|---|---|---|
| 2025 | $8,682 | $659,200 | $278,300 | $380,900 |
| 2024 | $8,625 | $638,900 | $290,400 | $348,500 |
| 2023 | $8,381 | $594,800 | $290,400 | $304,400 |
| 2022 | $8,070 | $532,000 | $268,800 | $263,200 |
| 2021 | $7,814 | $508,700 | $224,100 | $284,600 |
| 2020 | $7,698 | $501,200 | $224,100 | $277,100 |
| 2019 | $7,096 | $466,200 | $186,600 | $279,600 |
| 2018 | $6,740 | $452,600 | $178,000 | $274,600 |
| 2017 | $6,607 | $439,900 | $172,900 | $267,000 |
| 2016 | $6,343 | $411,600 | $164,700 | $246,900 |
| 2015 | $6,185 | $399,000 | $164,700 | $234,300 |
Source: Public Records
Map
Nearby Homes
- 37 Oakleaf Dr
- 2 Oak St Unit 2D
- 2 Oak St Unit 2A
- 2 Oak St Unit 2C
- 2 Oak St Unit 2B
- 451R Gilbert St
- 9 Larson Farm Dr
- 176 Elm St
- 14 Country Club Way
- 150 Gilbert St
- 4 Village Way Unit F
- 250 Mansfield Ave Unit 66
- 4 Buckskin Dr
- 47 Old Farm Rd
- 50 Kimberly Dr
- 19 Precourt Ln
- 157 Mansfield Ave Unit 14
- 15 Reservoir St Unit 44
- 933 Pleasant St
- 136 Lindsey St