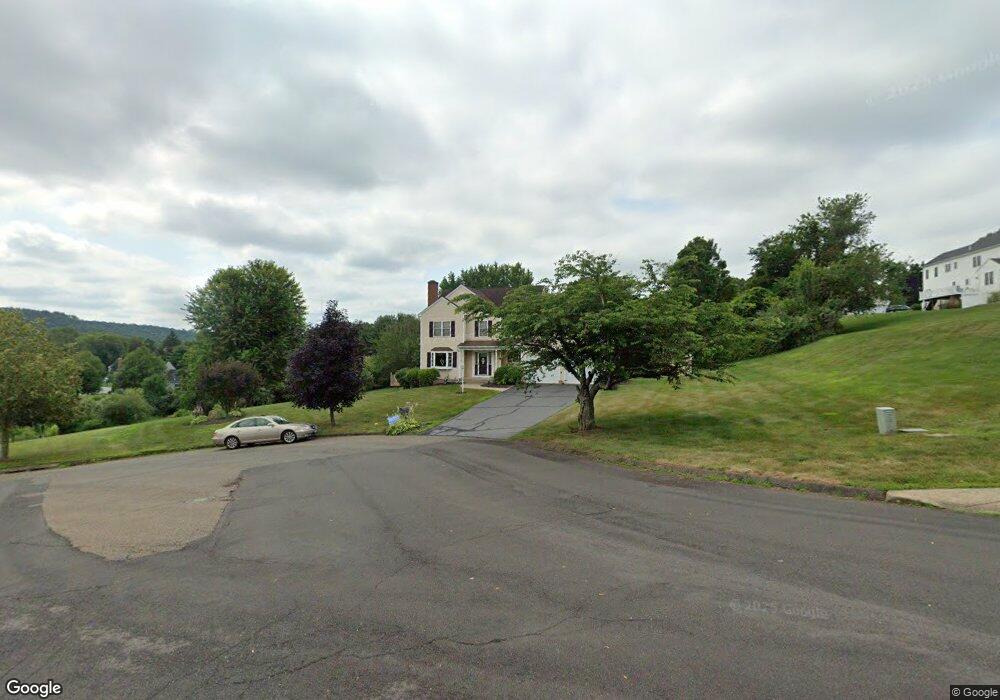
11 Patricks Ct Wallingford, CT 06492
Estimated Value: $641,451 - $745,000
3
Beds
3
Baths
2,279
Sq Ft
$302/Sq Ft
Est. Value
About This Home
This home is located at 11 Patricks Ct, Wallingford, CT 06492 and is currently estimated at $687,363, approximately $301 per square foot. 11 Patricks Ct is a home located in New Haven County with nearby schools including Moses Y Beach Elementary School, Rock Hill Elementary School, and Dag Hammarskjold Middle School.
Ownership History
Date
Name
Owned For
Owner Type
Purchase Details
Closed on
Jan 7, 2011
Sold by
Boutin Patrick J
Bought by
Boutin Anne F
Current Estimated Value
Home Financials for this Owner
Home Financials are based on the most recent Mortgage that was taken out on this home.
Original Mortgage
$131,238
Interest Rate
4.83%
Purchase Details
Closed on
Apr 9, 1999
Sold by
Heritage Hills
Bought by
Boutin Patrick J and Boutin Anne F
Create a Home Valuation Report for This Property
The Home Valuation Report is an in-depth analysis detailing your home's value as well as a comparison with similar homes in the area
Home Values in the Area
Average Home Value in this Area
Purchase History
| Date | Buyer | Sale Price | Title Company |
|---|---|---|---|
| Boutin Anne F | -- | -- | |
| Boutin Anne F | -- | -- | |
| Boutin Patrick J | $237,159 | -- | |
| Boutin Patrick J | $237,159 | -- |
Source: Public Records
Mortgage History
| Date | Status | Borrower | Loan Amount |
|---|---|---|---|
| Open | Boutin Patrick J | $135,000 | |
| Closed | Boutin Patrick J | $131,238 | |
| Closed | Boutin Patrick J | $135,000 |
Source: Public Records
Tax History
| Year | Tax Paid | Tax Assessment Tax Assessment Total Assessment is a certain percentage of the fair market value that is determined by local assessors to be the total taxable value of land and additions on the property. | Land | Improvement |
|---|---|---|---|---|
| 2025 | $9,648 | $400,000 | $119,600 | $280,400 |
| 2024 | $8,689 | $283,400 | $99,700 | $183,700 |
| 2023 | $8,315 | $283,400 | $99,700 | $183,700 |
| 2022 | $8,230 | $283,400 | $99,700 | $183,700 |
| 2021 | $8,083 | $283,400 | $99,700 | $183,700 |
| 2020 | $7,756 | $265,700 | $97,500 | $168,200 |
| 2019 | $13,322 | $265,700 | $97,500 | $168,200 |
| 2018 | $7,610 | $265,700 | $97,500 | $168,200 |
| 2017 | $13,000 | $265,700 | $97,500 | $168,200 |
| 2016 | $7,410 | $265,700 | $97,500 | $168,200 |
| 2015 | $7,513 | $273,500 | $97,500 | $176,000 |
| 2014 | $7,354 | $273,500 | $97,500 | $176,000 |
Source: Public Records
Map
Nearby Homes
- 19 Perkins Dr
- 101 Grieb Rd
- 1 Dean Dr
- 5 Kish Place
- 16 Marie Ln
- 46 Walnut Ln
- 570 N Main St
- 70 Putter Dr Unit 211
- 16 Putter Dr Unit 207S
- 21 Putter Dr Unit 303S
- 71 Cedar Ln
- 46 Cliffside Dr
- 27 Tamarac Swamp Rd
- 65 Brooklawn Dr
- 85 N Colony St
- 126 Cooke Rd
- 42 S Cherry St Unit 238
- 380 Main St Unit 3
- 380 Main St Unit 7
- 380 Main St Unit 4
Your Personal Tour Guide
Ask me questions while you tour the home.