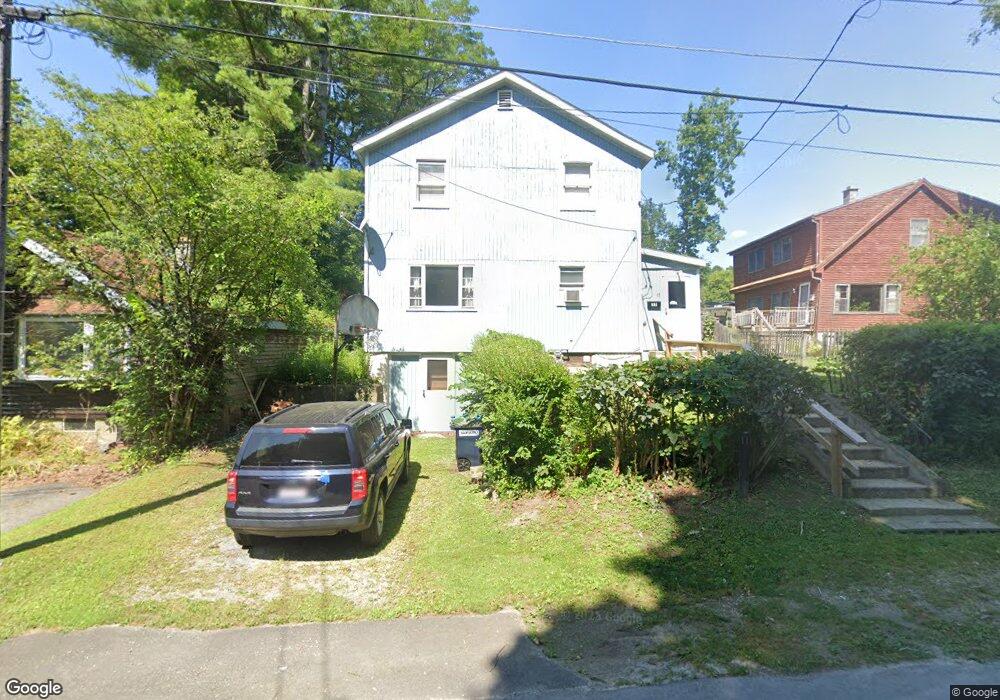
11 Paul Ave Pittsfield, MA 01201
Estimated Value: $265,405 - $329,000
4
Beds
2
Baths
1,646
Sq Ft
$184/Sq Ft
Est. Value
About This Home
This home is located at 11 Paul Ave, Pittsfield, MA 01201 and is currently estimated at $303,601, approximately $184 per square foot. 11 Paul Ave is a home located in Berkshire County with nearby schools including Robert T. Capeless Elementary School, John T. Reid Middle School, and Taconic High School.
Ownership History
Date
Name
Owned For
Owner Type
Purchase Details
Closed on
Aug 22, 2011
Sold by
Furlano Frank J and Furlano Karen M
Bought by
Furlano Frank J
Current Estimated Value
Home Financials for this Owner
Home Financials are based on the most recent Mortgage that was taken out on this home.
Original Mortgage
$196,500
Outstanding Balance
$191,612
Interest Rate
4.62%
Mortgage Type
Reverse Mortgage Home Equity Conversion Mortgage
Estimated Equity
$111,989
Purchase Details
Closed on
Jul 15, 1986
Bought by
Furlano Frank J
Create a Home Valuation Report for This Property
The Home Valuation Report is an in-depth analysis detailing your home's value as well as a comparison with similar homes in the area
Home Values in the Area
Average Home Value in this Area
Purchase History
| Date | Buyer | Sale Price | Title Company |
|---|---|---|---|
| Furlano Frank J | -- | -- | |
| Furlano Frank J | -- | -- | |
| Furlano Frank J | -- | -- | |
| Furlano Frank J | -- | -- |
Source: Public Records
Mortgage History
| Date | Status | Borrower | Loan Amount |
|---|---|---|---|
| Open | Furlano Frank J | $196,500 | |
| Closed | Furlano Frank J | $196,500 | |
| Previous Owner | Furlano Frank J | $81,000 |
Source: Public Records
Tax History
| Year | Tax Paid | Tax Assessment Tax Assessment Total Assessment is a certain percentage of the fair market value that is determined by local assessors to be the total taxable value of land and additions on the property. | Land | Improvement |
|---|---|---|---|---|
| 2025 | $4,254 | $237,100 | $79,800 | $157,300 |
| 2024 | $4,218 | $228,600 | $79,800 | $148,800 |
| 2023 | $3,942 | $215,200 | $79,800 | $135,400 |
| 2022 | $3,666 | $197,500 | $79,800 | $117,700 |
| 2021 | $3,324 | $172,700 | $79,800 | $92,900 |
| 2020 | $2,905 | $147,400 | $57,700 | $89,700 |
| 2019 | $2,629 | $135,400 | $48,800 | $86,600 |
| 2018 | $2,643 | $132,100 | $48,800 | $83,300 |
| 2017 | $2,489 | $126,800 | $46,600 | $80,200 |
| 2016 | $2,307 | $123,000 | $46,600 | $76,400 |
| 2015 | $2,221 | $123,000 | $46,600 | $76,400 |
Source: Public Records
Map
Nearby Homes
Your Personal Tour Guide
Ask me questions while you tour the home.