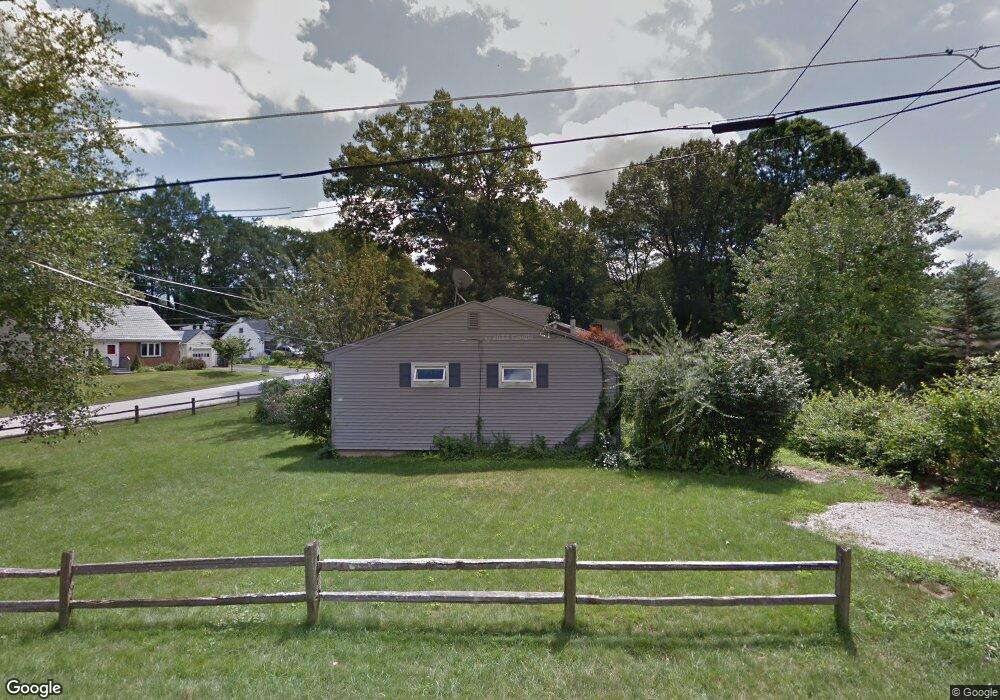
11 Paul St Auburn, MA 01501
Downtown Auburn NeighborhoodEstimated Value: $451,000 - $576,959
5
Beds
5
Baths
2,413
Sq Ft
$219/Sq Ft
Est. Value
About This Home
This home is located at 11 Paul St, Auburn, MA 01501 and is currently estimated at $528,740, approximately $219 per square foot. 11 Paul St is a home located in Worcester County with nearby schools including Auburn Senior High School and Shrewsbury Montessori School - Auburn Campus.
Ownership History
Date
Name
Owned For
Owner Type
Purchase Details
Closed on
Oct 30, 1987
Sold by
Stone Maybelle M
Bought by
Moore B Diane
Current Estimated Value
Create a Home Valuation Report for This Property
The Home Valuation Report is an in-depth analysis detailing your home's value as well as a comparison with similar homes in the area
Home Values in the Area
Average Home Value in this Area
Purchase History
| Date | Buyer | Sale Price | Title Company |
|---|---|---|---|
| Moore B Diane | $110,000 | -- |
Source: Public Records
Mortgage History
| Date | Status | Borrower | Loan Amount |
|---|---|---|---|
| Closed | Moore B Diane | $15,000 | |
| Closed | Moore B Diane | $90,000 | |
| Closed | Moore B Diane | $30,000 |
Source: Public Records
Tax History Compared to Growth
Tax History
| Year | Tax Paid | Tax Assessment Tax Assessment Total Assessment is a certain percentage of the fair market value that is determined by local assessors to be the total taxable value of land and additions on the property. | Land | Improvement |
|---|---|---|---|---|
| 2025 | $71 | $495,700 | $138,400 | $357,300 |
| 2024 | $7,431 | $497,700 | $132,100 | $365,600 |
| 2023 | $7,108 | $447,600 | $120,100 | $327,500 |
| 2022 | $6,565 | $390,300 | $120,100 | $270,200 |
| 2021 | $6,340 | $349,500 | $106,000 | $243,500 |
| 2020 | $6,110 | $339,800 | $106,000 | $233,800 |
| 2019 | $5,598 | $303,900 | $105,000 | $198,900 |
| 2018 | $5,296 | $287,200 | $97,700 | $189,500 |
| 2017 | $5,100 | $278,100 | $88,600 | $189,500 |
| 2016 | $4,939 | $273,000 | $92,700 | $180,300 |
| 2015 | $4,826 | $279,600 | $92,700 | $186,900 |
| 2014 | $4,660 | $269,500 | $88,200 | $181,300 |
Source: Public Records
Map
Nearby Homes