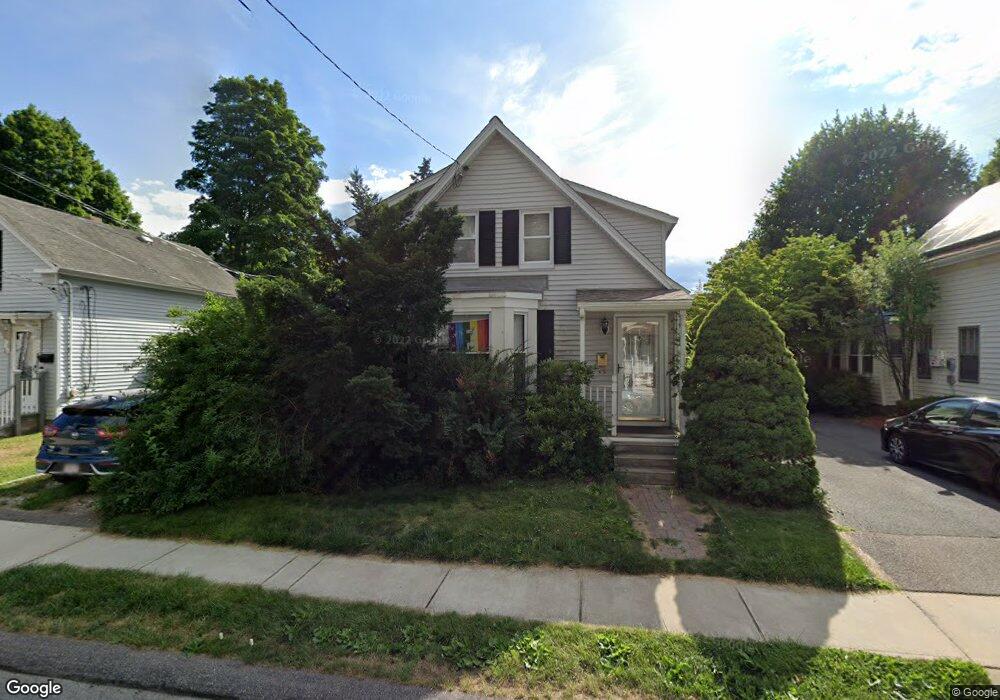
11 Pearl St Natick, MA 01760
Estimated Value: $729,621 - $897,000
3
Beds
2
Baths
1,677
Sq Ft
$478/Sq Ft
Est. Value
About This Home
This home is located at 11 Pearl St, Natick, MA 01760 and is currently estimated at $801,155, approximately $477 per square foot. 11 Pearl St is a home located in Middlesex County with nearby schools including Natick High School, Johnson Elementary School, and J F Kennedy Middle School.
Ownership History
Date
Name
Owned For
Owner Type
Purchase Details
Closed on
May 13, 1999
Sold by
Messom Eugene L and Messom Eileen P
Bought by
Siegal Michael B and Sherman Rebecca J
Current Estimated Value
Home Financials for this Owner
Home Financials are based on the most recent Mortgage that was taken out on this home.
Original Mortgage
$130,000
Outstanding Balance
$33,256
Interest Rate
6.92%
Mortgage Type
Purchase Money Mortgage
Estimated Equity
$767,899
Purchase Details
Closed on
Mar 31, 1989
Sold by
Perry Norman J
Bought by
Messon Eugene L
Create a Home Valuation Report for This Property
The Home Valuation Report is an in-depth analysis detailing your home's value as well as a comparison with similar homes in the area
Home Values in the Area
Average Home Value in this Area
Purchase History
| Date | Buyer | Sale Price | Title Company |
|---|---|---|---|
| Siegal Michael B | $260,000 | -- | |
| Messon Eugene L | $130,000 | -- |
Source: Public Records
Mortgage History
| Date | Status | Borrower | Loan Amount |
|---|---|---|---|
| Open | Messon Eugene L | $130,000 | |
| Previous Owner | Messon Eugene L | $160,000 | |
| Previous Owner | Messon Eugene L | $138,600 |
Source: Public Records
Tax History Compared to Growth
Tax History
| Year | Tax Paid | Tax Assessment Tax Assessment Total Assessment is a certain percentage of the fair market value that is determined by local assessors to be the total taxable value of land and additions on the property. | Land | Improvement |
|---|---|---|---|---|
| 2025 | $6,887 | $575,800 | $383,200 | $192,600 |
| 2024 | $6,651 | $542,500 | $361,900 | $180,600 |
| 2023 | $6,726 | $532,100 | $340,600 | $191,500 |
| 2022 | $6,483 | $486,000 | $310,800 | $175,200 |
| 2021 | $9,142 | $458,200 | $293,800 | $164,400 |
| 2020 | $5,888 | $432,600 | $268,200 | $164,400 |
| 2019 | $5,498 | $432,600 | $268,200 | $164,400 |
| 2018 | $6,721 | $402,000 | $255,500 | $146,500 |
| 2017 | $4,835 | $358,400 | $225,600 | $132,800 |
| 2016 | $4,655 | $343,000 | $211,400 | $131,600 |
| 2015 | $4,592 | $332,300 | $211,400 | $120,900 |
Source: Public Records
Map
Nearby Homes
- 8 Floral Ave Unit 8
- 8 Floral Avenue Extension
- 48 S Main St Unit 7
- 15 Church St Unit 3
- 49 Summer St
- 58 W Central St
- 47 High St
- 25 Forest Ave
- 6B Lincoln St Unit 6B
- 11 Avon St
- 4B Lincoln St Unit 4B
- 5 Wilson St Unit 5A
- 3 Wilson St Unit 3B
- 34 N Main St Unit 2
- 2 Yuba Place
- 26 Walnut St
- 6 Ambler Ct
- 4 Willow St
- 62 E Central St Unit 305
- 67 E Central St & 5 Union St