Estimated Value: $643,148 - $744,000
3
Beds
3
Baths
1,751
Sq Ft
$396/Sq Ft
Est. Value
About This Home
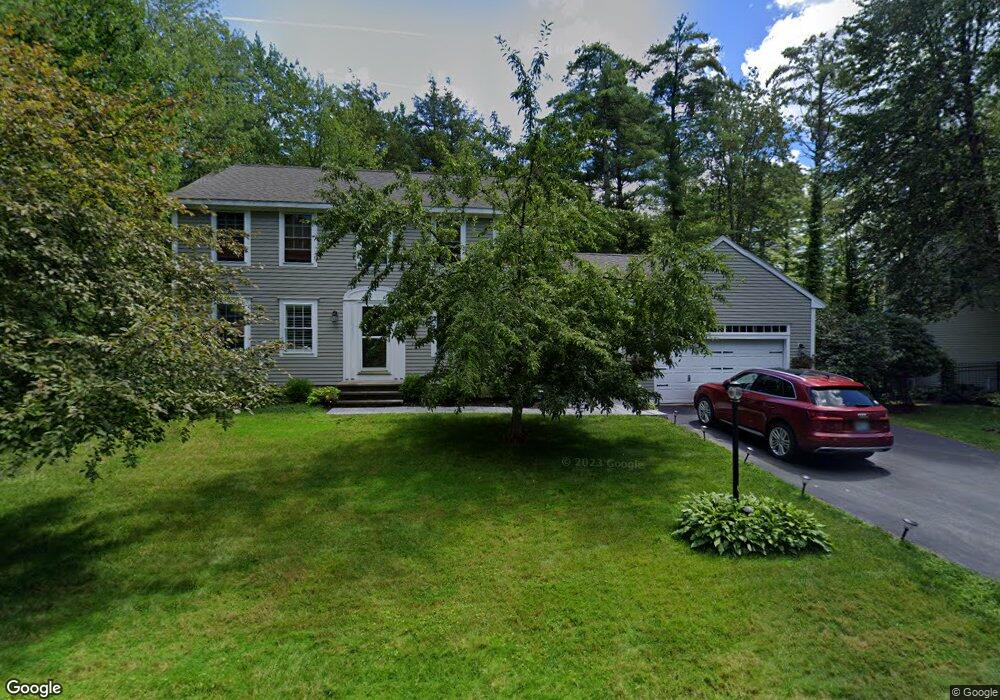
This home is located at 11 Pennacook Cir, Wells, ME 04090 and is currently estimated at $693,037, approximately $395 per square foot. 11 Pennacook Cir is a home located in York County with nearby schools including Wells Elementary School, Wells Junior High School, and Wells High School.
Ownership History
Date
Name
Owned For
Owner Type
Purchase Details
Closed on
Nov 1, 2018
Sold by
Cronin Thomas P and Cronin Aine A
Bought by
Omahoney Kimberly M
Current Estimated Value
Home Financials for this Owner
Home Financials are based on the most recent Mortgage that was taken out on this home.
Original Mortgage
$215,000
Outstanding Balance
$187,510
Interest Rate
4.6%
Mortgage Type
New Conventional
Estimated Equity
$505,527
Purchase Details
Closed on
Aug 5, 2013
Sold by
Chase Christian J and Chase Christian
Bought by
Cronin Thomas P and Omahoney Aine A
Home Financials for this Owner
Home Financials are based on the most recent Mortgage that was taken out on this home.
Original Mortgage
$236,000
Interest Rate
3.95%
Mortgage Type
New Conventional
Purchase Details
Closed on
Oct 22, 2009
Sold by
Kelly Eugene B Jr Est and Kelly
Bought by
Kelly Claudia Marie
Create a Home Valuation Report for This Property
The Home Valuation Report is an in-depth analysis detailing your home's value as well as a comparison with similar homes in the area
Home Values in the Area
Average Home Value in this Area
Purchase History
| Date | Buyer | Sale Price | Title Company |
|---|---|---|---|
| Omahoney Kimberly M | -- | -- | |
| Omahoney Kimberly M | -- | -- | |
| Omahoney Kimberly M | -- | -- | |
| Cronin Thomas P | -- | -- | |
| Cronin Thomas P | -- | -- | |
| Kelly Claudia Marie | -- | -- | |
| Kelly Claudia Marie | -- | -- |
Source: Public Records
Mortgage History
| Date | Status | Borrower | Loan Amount |
|---|---|---|---|
| Open | Omahoney Kimberly M | $215,000 | |
| Closed | Omahoney Kimberly M | $215,000 | |
| Previous Owner | Cronin Thomas P | $236,000 |
Source: Public Records
Tax History Compared to Growth
Tax History
| Year | Tax Paid | Tax Assessment Tax Assessment Total Assessment is a certain percentage of the fair market value that is determined by local assessors to be the total taxable value of land and additions on the property. | Land | Improvement |
|---|---|---|---|---|
| 2024 | $3,443 | $566,260 | $129,740 | $436,520 |
| 2023 | $3,375 | $566,260 | $129,740 | $436,520 |
| 2022 | $3,114 | $297,710 | $58,960 | $238,750 |
| 2021 | $3,132 | $297,710 | $58,960 | $238,750 |
| 2020 | $3,120 | $297,710 | $58,960 | $238,750 |
| 2019 | $3,102 | $297,710 | $58,960 | $238,750 |
| 2018 | $3,017 | $297,710 | $58,960 | $238,750 |
| 2017 | $3,025 | $297,710 | $58,960 | $238,750 |
| 2016 | $2,995 | $297,710 | $58,960 | $238,750 |
| 2015 | $2,962 | $297,710 | $58,960 | $238,750 |
| 2013 | $2,715 | $297,710 | $58,960 | $238,750 |
Source: Public Records
Map
Nearby Homes
- 392 Sanford Rd
- 417 Sanford Rd
- 23 College Dr Unit 121
- 23 College Dr Unit 16
- 150 Chapel Rd Unit 55
- 150 Chapel Rd Unit 105
- 21 Whistle Stop Cir
- 89 Skyline Cir
- 90 Poplar Park Dr
- 1372 Post Rd Unit 1C
- 47 Whistle Stop Cir
- 1413 Post Rd Unit 58
- 1373 Post Rd Unit 10A
- 1373 Post Rd Unit 4E
- 1373 Post Rd Unit 2C
- 1373 Post Rd Unit 6B
- 1373 Post Rd Unit 1F
- 1351 Post Rd Unit 49
- 4 Tidal Ct
- 1072 Post Rd Unit 131
- 5 Pennacook Cir
- 6 Pennacook Cir
- 21 Pennacook Cir
- 14 Pennacook Cir
- 26 Pennacook Cir
- 31 Pennacook Cir
- 441 Chapel Rd
- 37 Pennacook Cir
- 50 Pennacook Cir
- 451 Chapel Rd
- 45 Pennacook Cir
- 58 Pennacook Cir
- 108 Pennacook Cir
- 116 Pennacook Cir
- 66 Pennacook Cir
- 61 Pennacook Cir
- 90 Pennacook Cir
- 69 Pennacook Cir
- 115 Pennacook Cir
- 85 Pennacook Cir