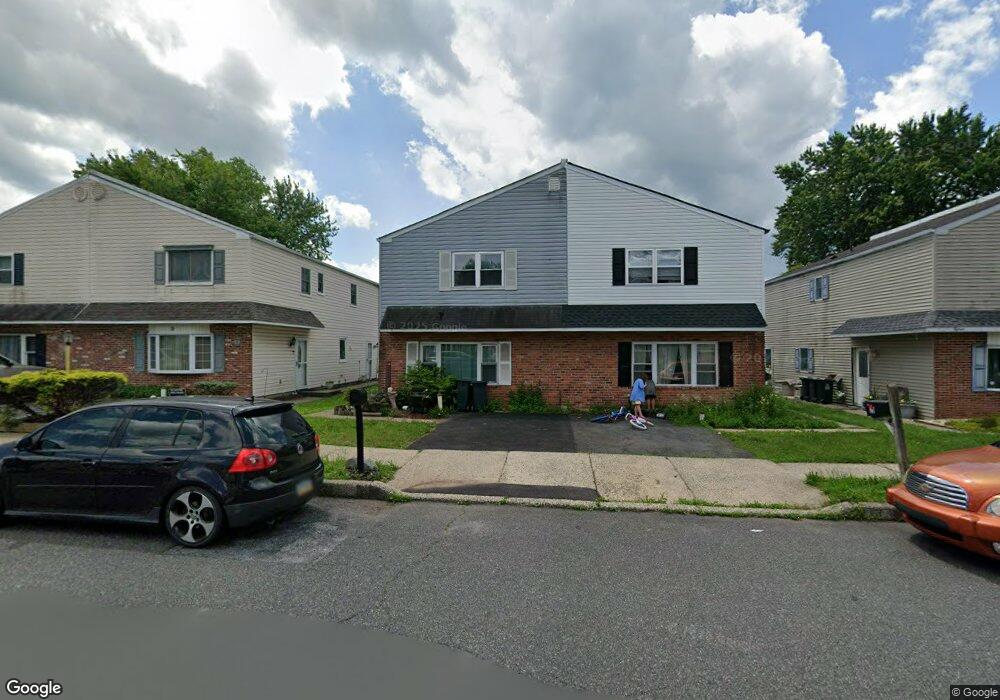
11 Pennington Ln Quakertown, PA 18951
Estimated Value: $279,000 - $329,238
3
Beds
2
Baths
1,596
Sq Ft
$190/Sq Ft
Est. Value
About This Home
This home is located at 11 Pennington Ln, Quakertown, PA 18951 and is currently estimated at $303,810, approximately $190 per square foot. 11 Pennington Ln is a home located in Bucks County with nearby schools including Strayer Middle School, Quakertown Community Senior High School, and United Friends School.
Ownership History
Date
Name
Owned For
Owner Type
Purchase Details
Closed on
Mar 11, 2022
Sold by
Wise Barbara E
Bought by
Wise Barbara E and Roseberry Darwin N
Current Estimated Value
Home Financials for this Owner
Home Financials are based on the most recent Mortgage that was taken out on this home.
Original Mortgage
$130,000
Outstanding Balance
$121,366
Interest Rate
3.85%
Mortgage Type
New Conventional
Estimated Equity
$182,444
Purchase Details
Closed on
Jan 13, 2004
Sold by
Moore Earl R
Bought by
Wise Barbara E
Purchase Details
Closed on
Jun 20, 2001
Sold by
Moore Earl R and Moore Susan I
Bought by
Moore Earl R
Purchase Details
Closed on
Apr 4, 1995
Sold by
Menta Anthony Henry and Menta Mary
Bought by
Moore Earl R and Moore Susan I
Home Financials for this Owner
Home Financials are based on the most recent Mortgage that was taken out on this home.
Original Mortgage
$84,000
Interest Rate
8.2%
Create a Home Valuation Report for This Property
The Home Valuation Report is an in-depth analysis detailing your home's value as well as a comparison with similar homes in the area
Home Values in the Area
Average Home Value in this Area
Purchase History
| Date | Buyer | Sale Price | Title Company |
|---|---|---|---|
| Wise Barbara E | -- | Pennsbury Abstract | |
| Wise Barbara E | $125,000 | -- | |
| Moore Earl R | -- | -- | |
| Moore Earl R | $84,000 | -- |
Source: Public Records
Mortgage History
| Date | Status | Borrower | Loan Amount |
|---|---|---|---|
| Open | Wise Barbara E | $130,000 | |
| Previous Owner | Moore Earl R | $84,000 |
Source: Public Records
Tax History Compared to Growth
Tax History
| Year | Tax Paid | Tax Assessment Tax Assessment Total Assessment is a certain percentage of the fair market value that is determined by local assessors to be the total taxable value of land and additions on the property. | Land | Improvement |
|---|---|---|---|---|
| 2025 | $3,309 | $16,440 | $3,000 | $13,440 |
| 2024 | $3,309 | $16,440 | $3,000 | $13,440 |
| 2023 | $3,276 | $16,440 | $3,000 | $13,440 |
| 2022 | $3,221 | $16,440 | $3,000 | $13,440 |
| 2021 | $3,221 | $16,440 | $3,000 | $13,440 |
| 2020 | $3,221 | $16,440 | $3,000 | $13,440 |
| 2019 | $3,131 | $16,440 | $3,000 | $13,440 |
| 2018 | $3,022 | $16,440 | $3,000 | $13,440 |
| 2017 | $2,929 | $16,440 | $3,000 | $13,440 |
| 2016 | $2,929 | $16,440 | $3,000 | $13,440 |
| 2015 | -- | $16,440 | $3,000 | $13,440 |
| 2014 | -- | $16,440 | $3,000 | $13,440 |
Source: Public Records
Map
Nearby Homes
- 56 Dewsbury Ln
- 94 Braithwaite Ln
- 89 Braithwaite Ln
- 36 S Main St
- 4 Stonegate Village
- 232 S 10th St
- 2060 Rohrbach Ln
- 908 Juniper St
- 803 W Broad St
- 811 W Mill St
- 27 S 7th St
- 8 Fonthill Ct
- 112 Jefferson Ct
- 48 Fonthill Ct
- 306 Juniper St
- 202 Andover Ct Unit 202
- 1206 Arbor Ct
- 1221 Garden Ct
- 12 Wagon Wheel Rd Unit 12
- 141 S 2nd St
- 13 Pennington Ln
- 9 Pennington Ln
- 15 Pennington Ln
- 7 Pennington Ln
- 17 Pennington Ln
- 8 Braxton Ct
- 10 Braxton Ct
- 19 Pennington Ln
- 126 Hickory Dr
- 128 Hickory Dr
- 9 Braxton Ct
- 6 Braxton Ct
- 23 Pennington Ln
- 130 Hickory Dr
- 10 Pennington Ln
- 8 Pennington Ln
- 12 Pennington Ln
- 14 Pennington Ln
- 132 Hickory Dr
- 7 Braxton Ct