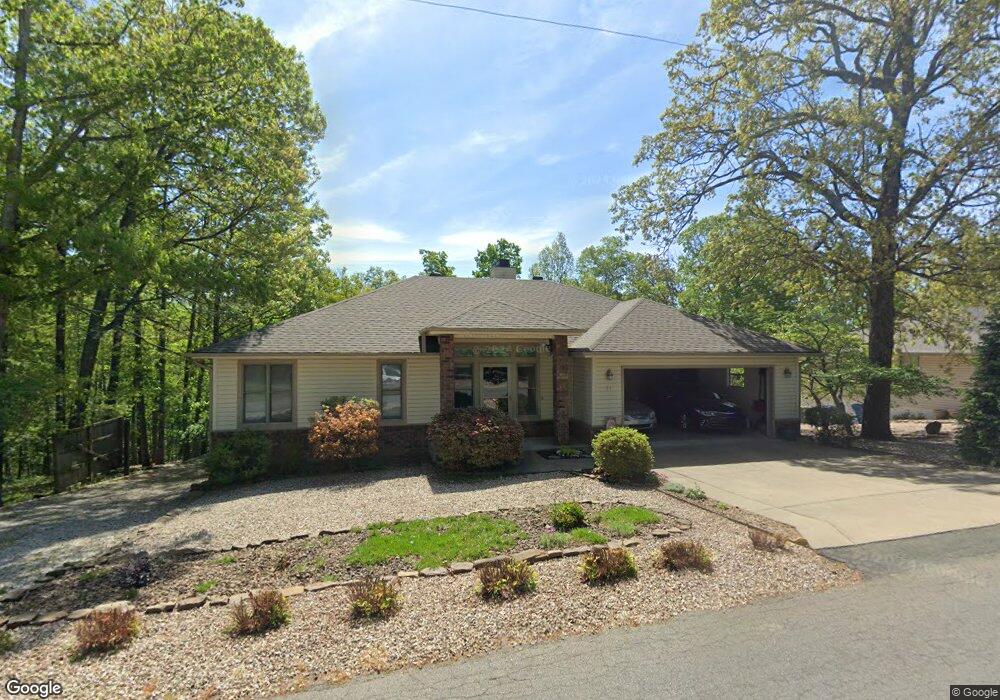
11 Penrith Dr Bella Vista, AR 72714
Estimated Value: $360,207 - $392,000
3
Beds
2
Baths
2,000
Sq Ft
$186/Sq Ft
Est. Value
About This Home
This home is located at 11 Penrith Dr, Bella Vista, AR 72714 and is currently estimated at $372,302, approximately $186 per square foot. 11 Penrith Dr is a home located in Benton County with nearby schools including Cooper Elementary School, Old High Middle School, and Washington Junior High School.
Ownership History
Date
Name
Owned For
Owner Type
Purchase Details
Closed on
Sep 20, 2017
Sold by
Krist Jerry and Krist Joyce L
Bought by
Krist Jerry and Krist Joyce L
Current Estimated Value
Purchase Details
Closed on
Jan 10, 2007
Sold by
Simon William D and Simon Verda M
Bought by
Krist Jerry and Krist Joyce L
Home Financials for this Owner
Home Financials are based on the most recent Mortgage that was taken out on this home.
Original Mortgage
$31,600
Interest Rate
6.1%
Mortgage Type
Unknown
Purchase Details
Closed on
Sep 21, 1998
Bought by
Simon
Purchase Details
Closed on
Jan 25, 1993
Bought by
Morin
Purchase Details
Closed on
May 28, 1992
Bought by
Rude
Purchase Details
Closed on
Aug 7, 1990
Bought by
Reynolds Trust
Purchase Details
Closed on
Nov 12, 1981
Bought by
Reynolds
Create a Home Valuation Report for This Property
The Home Valuation Report is an in-depth analysis detailing your home's value as well as a comparison with similar homes in the area
Home Values in the Area
Average Home Value in this Area
Purchase History
| Date | Buyer | Sale Price | Title Company |
|---|---|---|---|
| Krist Jerry | -- | None Available | |
| Krist Jerry | $158,000 | None Available | |
| Simon | $103,000 | -- | |
| Morin | $87,000 | -- | |
| Rude | $4,000 | -- | |
| Reynolds Trust | -- | -- | |
| Reynolds | -- | -- |
Source: Public Records
Mortgage History
| Date | Status | Borrower | Loan Amount |
|---|---|---|---|
| Closed | Krist Jerry | $31,600 | |
| Open | Krist Jerry | $126,400 |
Source: Public Records
Tax History Compared to Growth
Tax History
| Year | Tax Paid | Tax Assessment Tax Assessment Total Assessment is a certain percentage of the fair market value that is determined by local assessors to be the total taxable value of land and additions on the property. | Land | Improvement |
|---|---|---|---|---|
| 2025 | $1,744 | $64,511 | $1,600 | $62,911 |
| 2024 | $1,726 | $64,511 | $1,600 | $62,911 |
| 2023 | $1,726 | $41,550 | $800 | $40,750 |
| 2022 | $1,404 | $41,550 | $800 | $40,750 |
| 2021 | $1,403 | $41,550 | $800 | $40,750 |
| 2020 | $1,419 | $29,740 | $600 | $29,140 |
| 2019 | $1,419 | $29,740 | $600 | $29,140 |
| 2018 | $1,444 | $29,740 | $600 | $29,140 |
| 2017 | $1,376 | $29,740 | $600 | $29,140 |
| 2016 | $1,376 | $29,740 | $600 | $29,140 |
| 2015 | $1,698 | $28,160 | $1,000 | $27,160 |
| 2014 | $1,348 | $28,160 | $1,000 | $27,160 |
Source: Public Records
Map
Nearby Homes
- 3 Parton Ln
- 3 Yoxall Ln
- 3 Donington Ln
- 1 Lea Ln
- 11 Westerham Ln
- 0 Donington Ln Unit 1327370
- Lots 37 & 38 Lambeth Dr
- 9 Farnham Dr
- 21 Chudleigh Ln
- 6 Byron Ln
- 8 Kenilworth Dr
- 0 Lavendon Circle Dr
- 4 Wareham Ln
- 1 Newent Ln
- 9 Wantage Ln
- 0 Lambeth Ln
- 5 Thirsk Ln
- 22 Bellingham Ln
- 11 Thirsk Ln
- 12 Manchester Dr