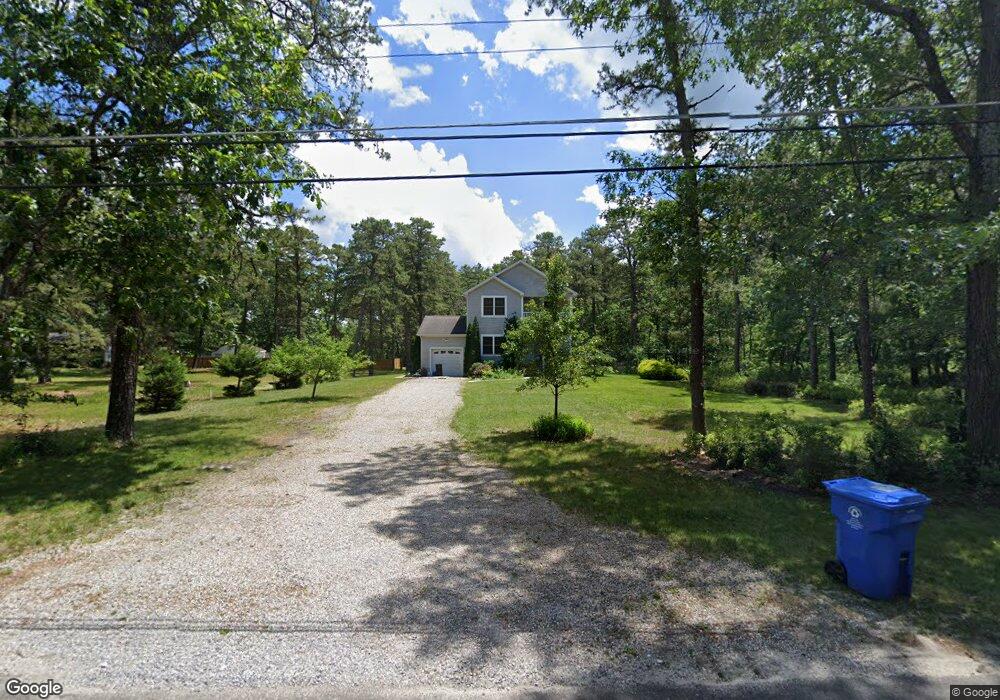
11 Pepper Rd Browns Mills, NJ 08015
Estimated Value: $364,000 - $506,000
--
Bed
--
Bath
2,168
Sq Ft
$192/Sq Ft
Est. Value
About This Home
This home is located at 11 Pepper Rd, Browns Mills, NJ 08015 and is currently estimated at $417,200, approximately $192 per square foot. 11 Pepper Rd is a home.
Ownership History
Date
Name
Owned For
Owner Type
Purchase Details
Closed on
Apr 22, 2011
Sold by
Colangelo Anthony P
Bought by
Colangelo Anthony P and Colangelo Catherine A
Current Estimated Value
Home Financials for this Owner
Home Financials are based on the most recent Mortgage that was taken out on this home.
Original Mortgage
$225,000
Outstanding Balance
$155,375
Interest Rate
4.82%
Mortgage Type
Construction
Estimated Equity
$261,825
Purchase Details
Closed on
Dec 7, 2007
Sold by
Balaong Archimedes L
Bought by
Colangelo Anthony
Create a Home Valuation Report for This Property
The Home Valuation Report is an in-depth analysis detailing your home's value as well as a comparison with similar homes in the area
Home Values in the Area
Average Home Value in this Area
Purchase History
| Date | Buyer | Sale Price | Title Company |
|---|---|---|---|
| Colangelo Anthony P | -- | None Available | |
| Colangelo Anthony | $43,500 | None Available |
Source: Public Records
Mortgage History
| Date | Status | Borrower | Loan Amount |
|---|---|---|---|
| Open | Colangelo Anthony P | $225,000 |
Source: Public Records
Tax History Compared to Growth
Tax History
| Year | Tax Paid | Tax Assessment Tax Assessment Total Assessment is a certain percentage of the fair market value that is determined by local assessors to be the total taxable value of land and additions on the property. | Land | Improvement |
|---|---|---|---|---|
| 2025 | $7,295 | $238,000 | $37,000 | $201,000 |
| 2024 | $6,845 | $238,000 | $37,000 | $201,000 |
| 2023 | $6,845 | $238,000 | $37,000 | $201,000 |
| 2022 | $6,336 | $238,000 | $37,000 | $201,000 |
| 2021 | $6,076 | $238,000 | $37,000 | $201,000 |
| 2020 | $5,848 | $238,000 | $37,000 | $201,000 |
| 2019 | $5,600 | $238,000 | $37,000 | $201,000 |
| 2018 | $5,410 | $238,000 | $37,000 | $201,000 |
| 2017 | $5,298 | $238,000 | $37,000 | $201,000 |
| 2016 | $4,687 | $125,400 | $20,000 | $105,400 |
| 2015 | $4,650 | $125,400 | $20,000 | $105,400 |
| 2014 | $4,445 | $125,400 | $20,000 | $105,400 |
Source: Public Records
Map
Nearby Homes