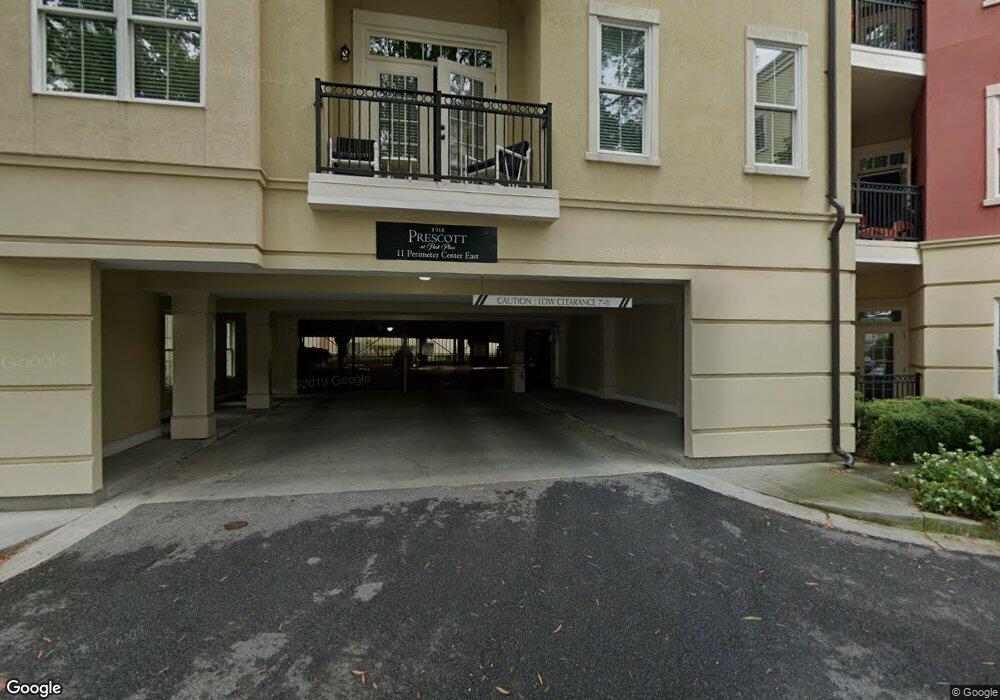
11 Perimeter Center E Unit 2106 Dunwoody, GA 30346
Estimated Value: $319,000 - $384,000
2
Beds
1
Bath
1,029
Sq Ft
$331/Sq Ft
Est. Value
About This Home
This home is located at 11 Perimeter Center E Unit 2106, Dunwoody, GA 30346 and is currently estimated at $340,932, approximately $331 per square foot. 11 Perimeter Center E Unit 2106 is a home located in DeKalb County with nearby schools including Dunwoody Elementary School, Peachtree Middle School, and Dunwoody High School.
Ownership History
Date
Name
Owned For
Owner Type
Purchase Details
Closed on
Mar 26, 2025
Sold by
Rabow Lisa L
Bought by
Rabow Williams Lisa and Rabow Jeffrey Williams
Current Estimated Value
Purchase Details
Closed on
Sep 30, 2024
Sold by
Rabow Lisa L
Bought by
Rabow Lisa L and Williams Scott Jeffrey
Purchase Details
Closed on
Jul 11, 2017
Sold by
Moseri Stephen
Bought by
Rabow Lisa L
Purchase Details
Closed on
Feb 20, 2015
Sold by
Newman Charles Rex
Bought by
Moseri Stephen
Home Financials for this Owner
Home Financials are based on the most recent Mortgage that was taken out on this home.
Original Mortgage
$182,041
Interest Rate
4.4%
Mortgage Type
FHA
Purchase Details
Closed on
Oct 25, 2013
Sold by
Dickson Bradford C
Bought by
Newman Charles Rex
Home Financials for this Owner
Home Financials are based on the most recent Mortgage that was taken out on this home.
Original Mortgage
$152,192
Interest Rate
4.25%
Mortgage Type
FHA
Purchase Details
Closed on
Jun 9, 2010
Sold by
Dickson Bradford C
Bought by
Dickson Bradford C and Dickson Bradford C
Create a Home Valuation Report for This Property
The Home Valuation Report is an in-depth analysis detailing your home's value as well as a comparison with similar homes in the area
Home Values in the Area
Average Home Value in this Area
Purchase History
| Date | Buyer | Sale Price | Title Company |
|---|---|---|---|
| Rabow Williams Lisa | -- | -- | |
| Rabow Lisa L | -- | -- | |
| Rabow Lisa L | $230,000 | -- | |
| Moseri Stephen | $185,400 | -- | |
| Newman Charles Rex | $155,000 | -- | |
| Dickson Bradford C | -- | -- |
Source: Public Records
Mortgage History
| Date | Status | Borrower | Loan Amount |
|---|---|---|---|
| Previous Owner | Moseri Stephen | $182,041 | |
| Previous Owner | Newman Charles Rex | $152,192 |
Source: Public Records
Tax History Compared to Growth
Tax History
| Year | Tax Paid | Tax Assessment Tax Assessment Total Assessment is a certain percentage of the fair market value that is determined by local assessors to be the total taxable value of land and additions on the property. | Land | Improvement |
|---|---|---|---|---|
| 2025 | $3,065 | $126,920 | $30,000 | $96,920 |
| 2024 | $3,082 | $124,920 | $30,000 | $94,920 |
| 2023 | $3,082 | $119,880 | $30,000 | $89,880 |
| 2022 | $2,648 | $104,280 | $25,120 | $79,160 |
| 2021 | $2,365 | $94,040 | $25,120 | $68,920 |
| 2020 | $2,382 | $91,960 | $25,120 | $66,840 |
| 2019 | $2,776 | $111,200 | $25,120 | $86,080 |
| 2018 | $2,006 | $87,480 | $25,120 | $62,360 |
| 2017 | $2,409 | $91,040 | $25,120 | $65,920 |
| 2016 | $1,929 | $73,000 | $25,120 | $47,880 |
| 2014 | $1,625 | $61,984 | $23,064 | $38,920 |
Source: Public Records
Map
Nearby Homes
- 11 Perimeter Center E Unit 1412
- 11 Perimeter Center E Unit 1303
- 11 Perimeter Center E Unit 1203
- 11 Perimeter Center E Unit 1116
- 4573 Village Springs Place
- 4561 Olde Perimeter Way Unit 2609
- 4561 Olde Perimeter Way Unit 1607
- 4561 Olde Perimeter Way Unit 1202
- 4561 Olde Perimeter Way Unit 704
- 4561 Olde Perimeter Way Unit 1701
- 4561 Olde Perimeter Way Unit 1207
- 4561 Olde Perimeter Way Unit 2407
- 1339 Valley View Rd
- 4694 Dogwood Aly
- 1155 Holly Ave
- 4666 Magnolia Commons
- 1610 Chateau Dr
- 1318 Mile Post Dr
- 4886 Valley View Ct
- 4320 Bethesda Trail
- 11 Perimeter Center E Unit 1315
- 11 Perimeter Center E Unit 1019
- 11 Perimeter Center E Unit 1118
- 11 Perimeter Center E Unit 1410
- 11 Perimeter Center E Unit 1402
- 11 Perimeter Center E Unit 2206
- 11 Perimeter Center E Unit 1203
- 11 Perimeter Center E Unit 1318
- 11 Perimeter Center E Unit 13003
- 11 Perimeter Center E Unit 1316
- 11 Perimeter Center E Unit 1416
- 11 Perimeter Center E Unit 1110
- 11 Perimeter Center E Unit 1101
- 11 Perimeter Center E Unit 1301
- 11 Perimeter Center E Unit 1213
- 11 Perimeter Center E Unit 1310
- 11 Perimeter Center E Unit 1105
- 11 Perimeter Center E Unit 2307
- 11 Perimeter Center E Unit 2102
- 11 Perimeter Center E Unit 1111