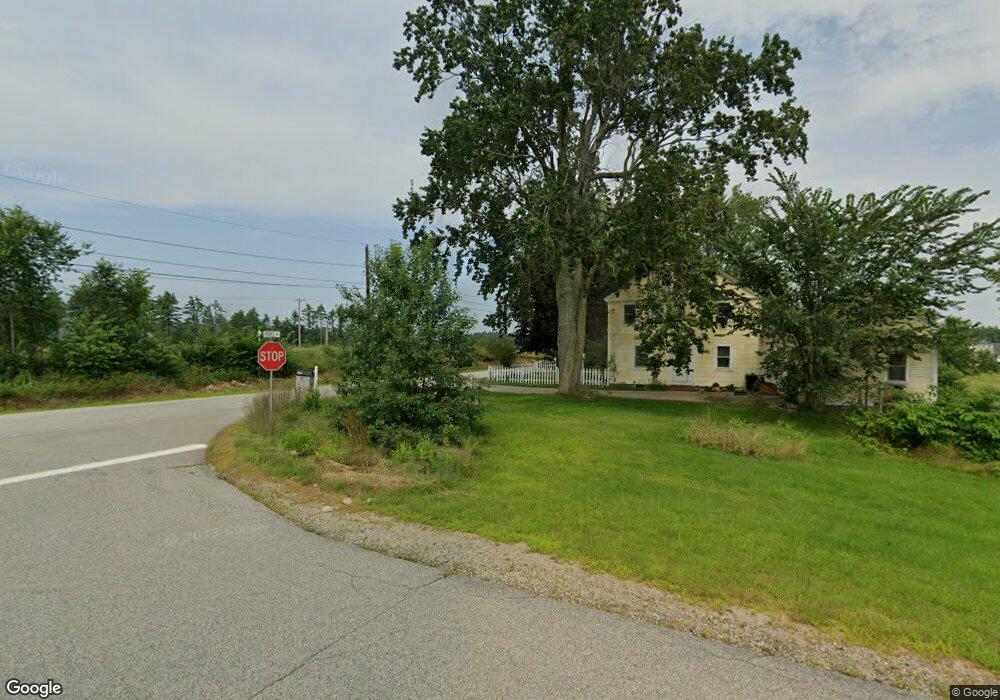
11 Perrys Way Berwick, ME 03901
Estimated Value: $747,000 - $964,000
4
Beds
4
Baths
3,061
Sq Ft
$277/Sq Ft
Est. Value
About This Home
This home is located at 11 Perrys Way, Berwick, ME 03901 and is currently estimated at $846,740, approximately $276 per square foot. 11 Perrys Way is a home located in York County with nearby schools including Noble High School, Berwick Academy, and Seacoast Christian School.
Ownership History
Date
Name
Owned For
Owner Type
Purchase Details
Closed on
May 31, 2005
Sold by
Flynn Building & Dev Corp
Bought by
Leveille Heidi M and Leveille Brandon W
Current Estimated Value
Home Financials for this Owner
Home Financials are based on the most recent Mortgage that was taken out on this home.
Original Mortgage
$329,720
Outstanding Balance
$174,785
Interest Rate
6%
Mortgage Type
Adjustable Rate Mortgage/ARM
Estimated Equity
$671,955
Create a Home Valuation Report for This Property
The Home Valuation Report is an in-depth analysis detailing your home's value as well as a comparison with similar homes in the area
Home Values in the Area
Average Home Value in this Area
Purchase History
| Date | Buyer | Sale Price | Title Company |
|---|---|---|---|
| Leveille Heidi M | -- | -- |
Source: Public Records
Mortgage History
| Date | Status | Borrower | Loan Amount |
|---|---|---|---|
| Open | Leveille Heidi M | $329,720 |
Source: Public Records
Tax History Compared to Growth
Tax History
| Year | Tax Paid | Tax Assessment Tax Assessment Total Assessment is a certain percentage of the fair market value that is determined by local assessors to be the total taxable value of land and additions on the property. | Land | Improvement |
|---|---|---|---|---|
| 2024 | $9,394 | $753,300 | $112,000 | $641,300 |
| 2023 | $8,830 | $482,000 | $78,900 | $403,100 |
| 2022 | $8,782 | $482,000 | $78,900 | $403,100 |
| 2021 | $8,821 | $482,000 | $78,900 | $403,100 |
| 2020 | $7,339 | $379,100 | $78,900 | $300,200 |
| 2019 | $6,646 | $379,100 | $78,900 | $300,200 |
| 2018 | $5,884 | $334,300 | $75,100 | $259,200 |
| 2017 | $5,733 | $334,300 | $75,100 | $259,200 |
| 2016 | $5,449 | $334,300 | $75,100 | $259,200 |
| 2014 | $5,315 | $334,300 | $75,100 | $259,200 |
| 2013 | $5,366 | $334,300 | $75,100 | $259,200 |
Source: Public Records
Map
Nearby Homes
- 5 Knights Pond Rd
- 43 Knights Pond Rd
- 289 Main St
- 10 Portland St
- 275 Main St
- 24 Spillanes Hill
- 13 Beaver Dam Rd
- 26 Stevens Ct
- 22 High Knoll Dr
- 442 Prospect St
- 208 Knights Pond Rd
- 72 Vine St
- 505 School St
- 32 Camden Rd
- 6 Friendship Ct
- 3 Blackberry Hill Rd
- 72 Moses Carr Rd
- 29 Great Hill Rd
- 17 2nd St
- 5 Heritage Dr
- 12 Perrys Way
- 1 Perry's Way
- 2 Perry's Way
- 3 Perry's Way
- 20 Circuit Rd
- 12 Circuit Rd
- 13 Circuit Rd
- 14 Perrys Way
- 8 Circuit Rd
- 357 Portland St
- 5 Circuit Rd
- 11 Pond Rd
- - Pond
- 355 Portland St
- 365 Blackberry Hill Rd
- 4 Circuit Rd
- 370 Blackberry Hill Rd
- 366 Blackberry Hill Rd
- 375 Portland St
- 371 Portland St