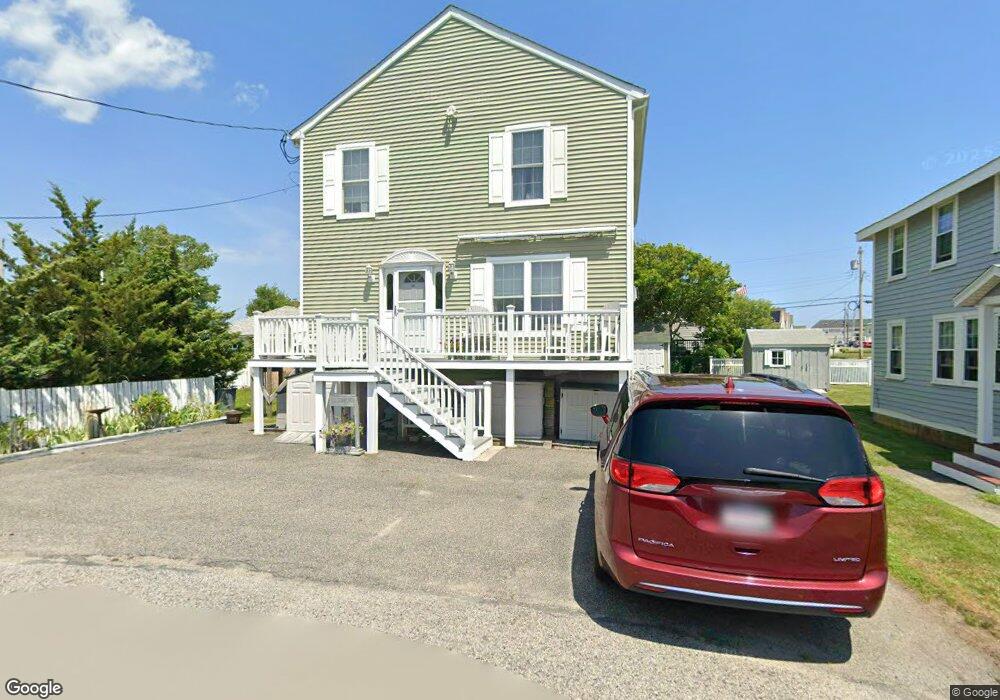
11 Pershing Rd Marshfield, MA 02050
Ocean Bluff-Brant Rock NeighborhoodEstimated Value: $820,844 - $990,000
4
Beds
3
Baths
1,872
Sq Ft
$486/Sq Ft
Est. Value
About This Home
This home is located at 11 Pershing Rd, Marshfield, MA 02050 and is currently estimated at $910,711, approximately $486 per square foot. 11 Pershing Rd is a home with nearby schools including Daniel Webster, Furnace Brook Middle School, and Marshfield High School.
Ownership History
Date
Name
Owned For
Owner Type
Purchase Details
Closed on
Jun 25, 2021
Sold by
Marmaud Steven E
Bought by
Marmaud Steven E and Marmaud Dawn M
Current Estimated Value
Purchase Details
Closed on
Oct 24, 1994
Sold by
Pershing Rd Rt and Murray Lawrence M
Bought by
Marmaud Steven E and Marmaud Edward R
Create a Home Valuation Report for This Property
The Home Valuation Report is an in-depth analysis detailing your home's value as well as a comparison with similar homes in the area
Home Values in the Area
Average Home Value in this Area
Purchase History
| Date | Buyer | Sale Price | Title Company |
|---|---|---|---|
| Marmaud Steven E | -- | None Available | |
| Marmaud Steven E | $55,000 | -- |
Source: Public Records
Mortgage History
| Date | Status | Borrower | Loan Amount |
|---|---|---|---|
| Previous Owner | Marmaud Steven E | $305,000 | |
| Previous Owner | Marmaud Steven E | $305,000 | |
| Previous Owner | Marmaud Steven E | $244,000 | |
| Previous Owner | Marmaud Steven E | $45,750 |
Source: Public Records
Tax History Compared to Growth
Tax History
| Year | Tax Paid | Tax Assessment Tax Assessment Total Assessment is a certain percentage of the fair market value that is determined by local assessors to be the total taxable value of land and additions on the property. | Land | Improvement |
|---|---|---|---|---|
| 2025 | $6,504 | $657,000 | $282,200 | $374,800 |
| 2024 | $6,279 | $604,300 | $264,600 | $339,700 |
| 2023 | $5,912 | $533,300 | $238,100 | $295,200 |
| 2022 | $5,912 | $456,500 | $202,900 | $253,600 |
| 2021 | $5,590 | $423,800 | $194,000 | $229,800 |
| 2020 | $5,217 | $391,400 | $167,600 | $223,800 |
| 2019 | $5,078 | $379,500 | $167,600 | $211,900 |
| 2018 | $5,020 | $375,500 | $167,600 | $207,900 |
| 2017 | $4,839 | $352,700 | $158,800 | $193,900 |
| 2016 | $4,604 | $331,700 | $149,900 | $181,800 |
| 2015 | $4,354 | $327,600 | $149,900 | $177,700 |
| 2014 | $4,279 | $322,000 | $149,900 | $172,100 |
Source: Public Records
Map
Nearby Homes