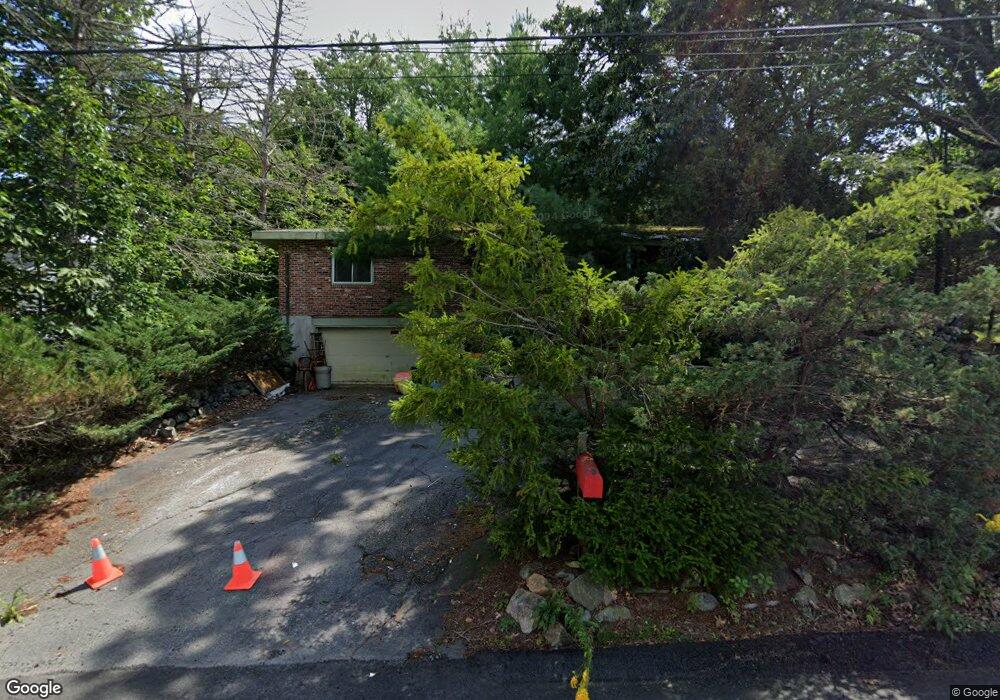
11 Pheasant Ln Woburn, MA 01801
Shakerhill NeighborhoodEstimated Value: $767,000 - $1,678,000
3
Beds
1
Bath
2,232
Sq Ft
$475/Sq Ft
Est. Value
About This Home
This home is located at 11 Pheasant Ln, Woburn, MA 01801 and is currently estimated at $1,059,907, approximately $474 per square foot. 11 Pheasant Ln is a home located in Middlesex County with nearby schools including Reeves Elementary School, Daniel L. Joyce Middle School, and Woburn High School.
Ownership History
Date
Name
Owned For
Owner Type
Purchase Details
Closed on
Jun 27, 2025
Sold by
Eleven Pheasants Llc
Bought by
Andrade Stephen P and Andrade Lina R
Current Estimated Value
Purchase Details
Closed on
Apr 12, 2024
Sold by
11 Pheasant Lane Llc
Bought by
Eleven Pheasants Llc
Home Financials for this Owner
Home Financials are based on the most recent Mortgage that was taken out on this home.
Original Mortgage
$870,000
Interest Rate
6.94%
Mortgage Type
Commercial
Purchase Details
Closed on
Sep 1, 2023
Sold by
Frongillo Jr Ralph B Est and Frongillo
Bought by
11 Pheasant Lane Llc
Purchase Details
Closed on
Apr 12, 1987
Sold by
Prospect St Ests In
Bought by
Frongillo Lillian S
Home Financials for this Owner
Home Financials are based on the most recent Mortgage that was taken out on this home.
Original Mortgage
$70,000
Interest Rate
9.02%
Mortgage Type
Purchase Money Mortgage
Create a Home Valuation Report for This Property
The Home Valuation Report is an in-depth analysis detailing your home's value as well as a comparison with similar homes in the area
Home Values in the Area
Average Home Value in this Area
Purchase History
| Date | Buyer | Sale Price | Title Company |
|---|---|---|---|
| Andrade Stephen P | -- | -- | |
| Eleven Pheasants Llc | $525,000 | None Available | |
| Eleven Pheasants Llc | $525,000 | None Available | |
| 11 Pheasant Lane Llc | $355,000 | None Available | |
| 11 Pheasant Lane Llc | $355,000 | None Available | |
| Frongillo Lillian S | $81,500 | -- |
Source: Public Records
Mortgage History
| Date | Status | Borrower | Loan Amount |
|---|---|---|---|
| Previous Owner | Eleven Pheasants Llc | $870,000 | |
| Previous Owner | Frongillo Lillian S | $70,000 |
Source: Public Records
Tax History Compared to Growth
Tax History
| Year | Tax Paid | Tax Assessment Tax Assessment Total Assessment is a certain percentage of the fair market value that is determined by local assessors to be the total taxable value of land and additions on the property. | Land | Improvement |
|---|---|---|---|---|
| 2025 | $5,607 | $656,600 | $390,000 | $266,600 |
| 2024 | $5,925 | $735,100 | $371,700 | $363,400 |
| 2023 | $5,987 | $688,200 | $337,900 | $350,300 |
| 2022 | $5,848 | $626,100 | $294,500 | $331,600 |
| 2021 | $5,503 | $589,800 | $280,700 | $309,100 |
| 2020 | $5,371 | $576,300 | $280,700 | $295,600 |
| 2019 | $6,468 | $547,700 | $267,600 | $280,100 |
| 2018 | $5,080 | $513,700 | $245,900 | $267,800 |
| 2017 | $6,590 | $493,700 | $234,400 | $259,300 |
| 2016 | $4,682 | $465,900 | $219,400 | $246,500 |
| 2015 | $4,508 | $443,300 | $205,300 | $238,000 |
| 2014 | $4,217 | $403,900 | $205,300 | $198,600 |
Source: Public Records
Map
Nearby Homes
- 7 Grace Rd
- 14 Liana St
- 2 Howard Ct
- 212 Cambridge Rd
- 185 Lexington St
- 192 Lexington St
- 14 Saw Mill Brook Way
- 123 Cambridge Rd Unit 4
- 9 Pond Terrace
- 49 Duren Ave
- 21 Derby Dr Unit 21
- 500 Lexington St Unit 6
- 273 Cambridge Rd Unit 202
- 19 Gershon Way Unit 1
- 19 Gershon Way
- 7 Thornberry Rd
- 269 Cambridge Rd Unit 203
- 41 Squire Rd
- 20 Amberwood Dr
- 36 Cambridge Rd Unit 40