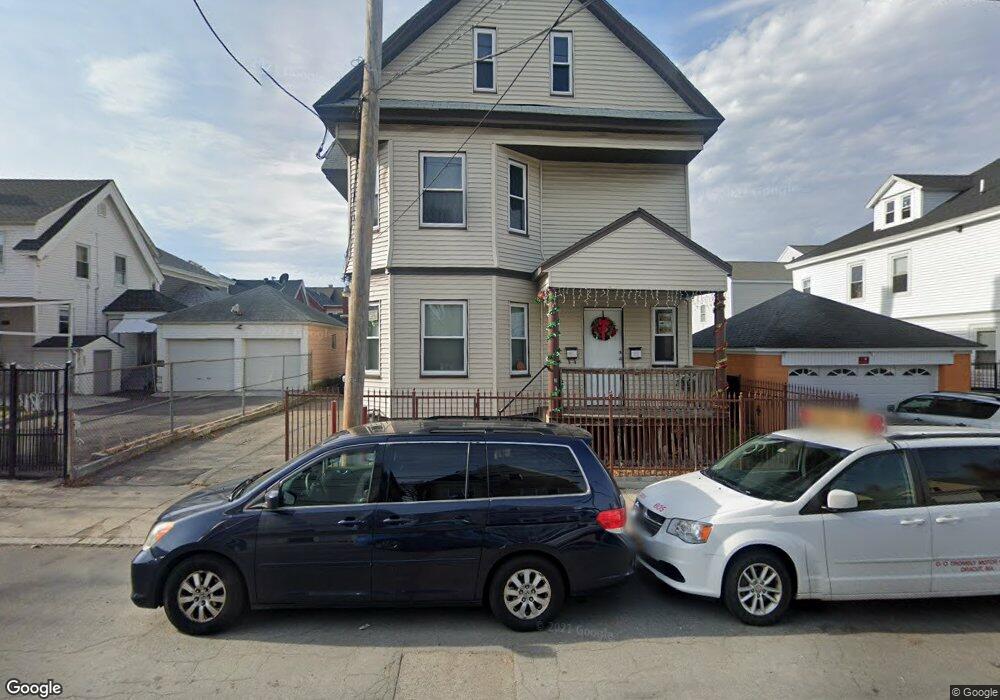
11 Phillips St Lawrence, MA 01843
South Common NeighborhoodEstimated Value: $573,000 - $828,000
6
Beds
2
Baths
2,747
Sq Ft
$255/Sq Ft
Est. Value
About This Home
This home is located at 11 Phillips St, Lawrence, MA 01843 and is currently estimated at $700,605, approximately $255 per square foot. 11 Phillips St is a home located in Essex County with nearby schools including John Breen School, South Lawrence East Elementary School, and School For Exceptional Studies.
Ownership History
Date
Name
Owned For
Owner Type
Purchase Details
Closed on
Oct 9, 2009
Sold by
Quinney Lai T
Bought by
Henriquez Eduard
Current Estimated Value
Home Financials for this Owner
Home Financials are based on the most recent Mortgage that was taken out on this home.
Original Mortgage
$167,910
Outstanding Balance
$109,978
Interest Rate
5.14%
Mortgage Type
Purchase Money Mortgage
Estimated Equity
$590,627
Purchase Details
Closed on
Oct 27, 2004
Sold by
Emerald Rt and Quinney David C
Bought by
Quinney Lai T
Create a Home Valuation Report for This Property
The Home Valuation Report is an in-depth analysis detailing your home's value as well as a comparison with similar homes in the area
Home Values in the Area
Average Home Value in this Area
Purchase History
| Date | Buyer | Sale Price | Title Company |
|---|---|---|---|
| Henriquez Eduard | $174,000 | -- | |
| Quinney Lai T | -- | -- |
Source: Public Records
Mortgage History
| Date | Status | Borrower | Loan Amount |
|---|---|---|---|
| Open | Henriquez Eduard | $167,910 |
Source: Public Records
Tax History
| Year | Tax Paid | Tax Assessment Tax Assessment Total Assessment is a certain percentage of the fair market value that is determined by local assessors to be the total taxable value of land and additions on the property. | Land | Improvement |
|---|---|---|---|---|
| 2025 | $4,844 | $550,400 | $85,800 | $464,600 |
| 2024 | $4,717 | $509,900 | $92,900 | $417,000 |
| 2023 | $4,576 | $450,400 | $86,100 | $364,300 |
| 2022 | $4,248 | $371,300 | $78,100 | $293,200 |
| 2021 | $4,131 | $336,700 | $78,100 | $258,600 |
| 2020 | $3,971 | $319,500 | $74,000 | $245,500 |
| 2019 | $3,990 | $291,700 | $61,500 | $230,200 |
| 2018 | $3,642 | $254,300 | $58,300 | $196,000 |
| 2017 | $3,363 | $219,200 | $55,000 | $164,200 |
| 2016 | $3,308 | $213,300 | $45,300 | $168,000 |
| 2015 | $3,248 | $214,800 | $45,300 | $169,500 |
Source: Public Records
Map
Nearby Homes
- 143 Foster St
- 80 Market St
- 356-360 S Union St
- 27-29 Dorchester St
- 31 Garfield St
- 4 Shawsheen Rd Unit 2
- 11 Fernwood St
- 82 S Broadway
- 57 Glenwood St
- 127 Marblehead St Unit A
- 12-12A Durham St
- 68 Union St
- 40 Chester St
- 41 Durham St
- 49 Bowdoin St Unit 51
- 341 S Broadway- Parcel II
- 24 Inman St Unit 6
- 24 Inman St Unit 4
- 219 Waverly Rd Unit 219
- 87-87A Brookfield St
- 9 Phillips St
- 148 Abbott St
- 146 Abbott St
- 185 Bailey St Unit 187
- 14 Phillips St Unit 1
- 14 Phillips St Unit 16
- 142 Abbott St
- 68 Phillips St
- 68 Phillips St
- 6-8 Phillips St
- 193 Bailey St
- 140 Abbott St
- 177 Bailey St
- 145 Abbott St Unit 147
- 155 Abbott St Unit 157
- 138 Abbott St
- 162 Abbott St
- 175 Bailey St
- 149 Abbott St
- 155-157 Abbott St