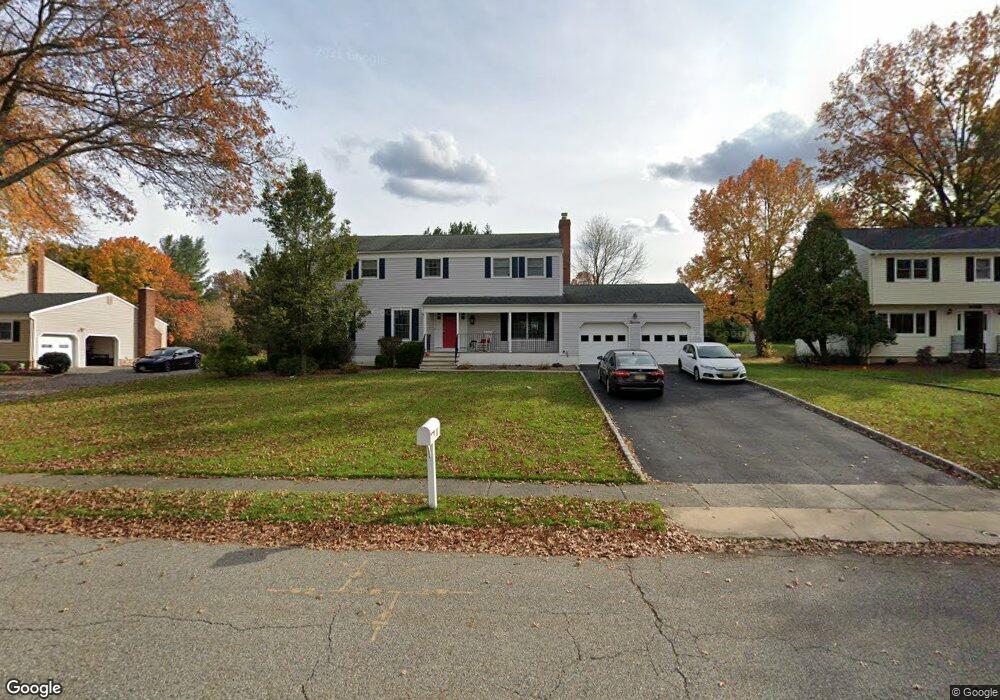
11 Phoenix Dr Mendham, NJ 07945
Estimated Value: $968,042 - $1,250,000
--
Bed
--
Bath
2,312
Sq Ft
$467/Sq Ft
Est. Value
About This Home
This home is located at 11 Phoenix Dr, Mendham, NJ 07945 and is currently estimated at $1,080,511, approximately $467 per square foot. 11 Phoenix Dr is a home located in Morris County with nearby schools including Hilltop Elementary School, Mountain View Middle School, and West Morris Mendham High School.
Ownership History
Date
Name
Owned For
Owner Type
Purchase Details
Closed on
Dec 12, 2016
Sold by
Danjaut Charles R and Danjaut Josette M
Bought by
Kelly Kenneth and Kelly Brigitte
Current Estimated Value
Home Financials for this Owner
Home Financials are based on the most recent Mortgage that was taken out on this home.
Original Mortgage
$437,500
Outstanding Balance
$353,818
Interest Rate
3.57%
Mortgage Type
New Conventional
Estimated Equity
$726,693
Create a Home Valuation Report for This Property
The Home Valuation Report is an in-depth analysis detailing your home's value as well as a comparison with similar homes in the area
Home Values in the Area
Average Home Value in this Area
Purchase History
| Date | Buyer | Sale Price | Title Company |
|---|---|---|---|
| Kelly Kenneth | $625,000 | Weichert Title Agency |
Source: Public Records
Mortgage History
| Date | Status | Borrower | Loan Amount |
|---|---|---|---|
| Open | Kelly Kenneth | $437,500 |
Source: Public Records
Tax History Compared to Growth
Tax History
| Year | Tax Paid | Tax Assessment Tax Assessment Total Assessment is a certain percentage of the fair market value that is determined by local assessors to be the total taxable value of land and additions on the property. | Land | Improvement |
|---|---|---|---|---|
| 2025 | $15,026 | $610,800 | $320,200 | $290,600 |
| 2024 | $14,989 | $610,800 | $320,200 | $290,600 |
| 2023 | $14,989 | $610,800 | $320,200 | $290,600 |
| 2022 | $14,305 | $610,800 | $320,200 | $290,600 |
| 2021 | $14,305 | $610,800 | $320,200 | $290,600 |
| 2020 | $14,055 | $610,800 | $320,200 | $290,600 |
| 2019 | $13,725 | $610,800 | $320,200 | $290,600 |
| 2018 | $12,933 | $583,900 | $320,200 | $263,700 |
| 2017 | $12,747 | $583,900 | $320,200 | $263,700 |
| 2016 | $12,361 | $583,900 | $320,200 | $263,700 |
| 2015 | $12,087 | $583,900 | $320,200 | $263,700 |
| 2014 | $11,771 | $583,900 | $320,200 | $263,700 |
Source: Public Records
Map
Nearby Homes