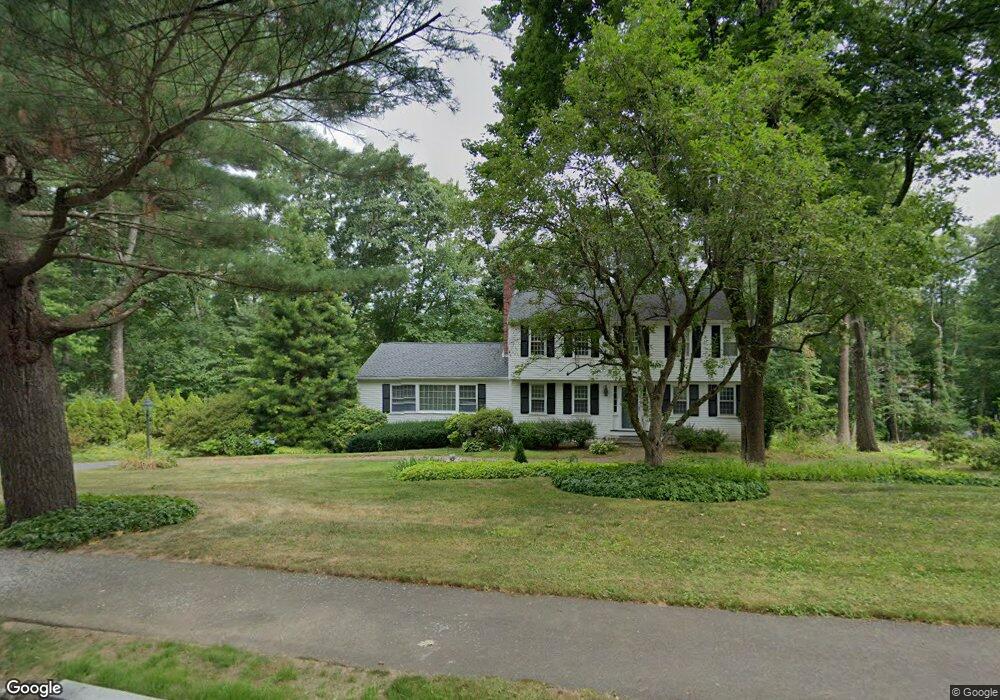
11 Pinecrest Dr Westborough, MA 01581
Estimated Value: $884,920 - $1,101,000
4
Beds
3
Baths
2,904
Sq Ft
$345/Sq Ft
Est. Value
About This Home
This home is located at 11 Pinecrest Dr, Westborough, MA 01581 and is currently estimated at $1,001,980, approximately $345 per square foot. 11 Pinecrest Dr is a home located in Worcester County with nearby schools including Westborough High School, Ebridge Montessori School, and Westboro Knowledge Beginnings.
Ownership History
Date
Name
Owned For
Owner Type
Purchase Details
Closed on
Mar 30, 1998
Sold by
Roizen Stephen R and Roizen Wendy C
Bought by
Garriety Edward and Garrity Lisa
Current Estimated Value
Purchase Details
Closed on
Nov 28, 1994
Sold by
Smack Laurence J and Smack Nancy J
Bought by
Roizen Stephen R and Roizen Wendy C
Create a Home Valuation Report for This Property
The Home Valuation Report is an in-depth analysis detailing your home's value as well as a comparison with similar homes in the area
Home Values in the Area
Average Home Value in this Area
Purchase History
| Date | Buyer | Sale Price | Title Company |
|---|---|---|---|
| Garriety Edward | $285,000 | -- | |
| Roizen Stephen R | $250,500 | -- |
Source: Public Records
Mortgage History
| Date | Status | Borrower | Loan Amount |
|---|---|---|---|
| Open | Roizen Stephen R | $350,000 | |
| Closed | Roizen Stephen R | $300,000 |
Source: Public Records
Tax History Compared to Growth
Tax History
| Year | Tax Paid | Tax Assessment Tax Assessment Total Assessment is a certain percentage of the fair market value that is determined by local assessors to be the total taxable value of land and additions on the property. | Land | Improvement |
|---|---|---|---|---|
| 2025 | $11,835 | $726,500 | $332,900 | $393,600 |
| 2024 | $11,279 | $687,300 | $316,900 | $370,400 |
| 2023 | $10,778 | $640,000 | $298,800 | $341,200 |
| 2022 | $10,020 | $541,900 | $244,600 | $297,300 |
| 2021 | $9,602 | $517,900 | $220,600 | $297,300 |
| 2020 | $9,272 | $506,100 | $216,600 | $289,500 |
| 2019 | $8,881 | $484,500 | $214,600 | $269,900 |
| 2018 | $3,070 | $446,400 | $206,500 | $239,900 |
| 2017 | $7,946 | $446,400 | $206,500 | $239,900 |
| 2016 | $7,874 | $443,100 | $200,500 | $242,600 |
| 2015 | $7,720 | $415,300 | $188,500 | $226,800 |
Source: Public Records
Map
Nearby Homes