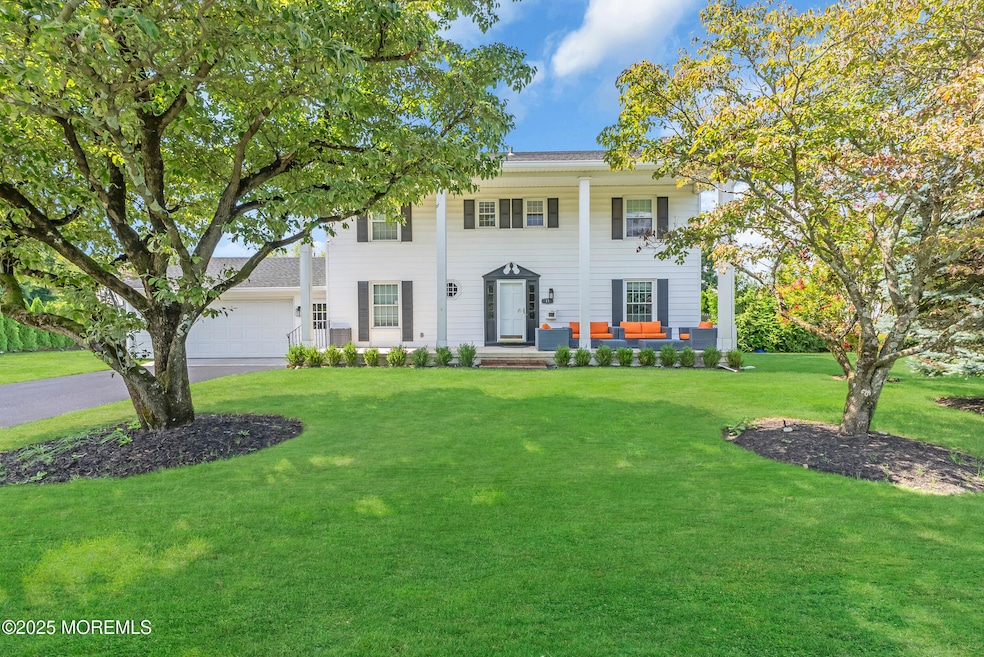
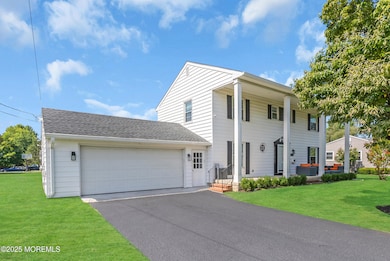
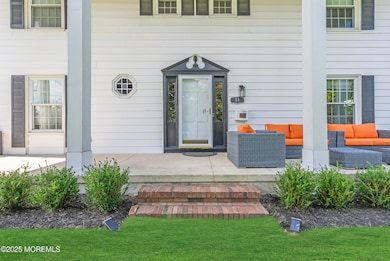
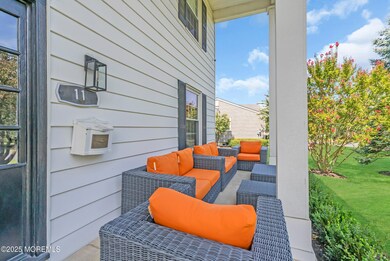
11 Pinewood Ave West Long Branch, NJ 07764
Highlights
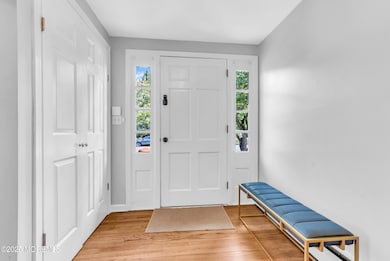
- Colonial Architecture
- Porch
- Central Air
- Deck
- 2 Car Attached Garage
- Baseboard Heating
About This Home
WINTER 2026-2027 Beautiful spacious home includes 4 bedrooms, 2 and a half bathrooms. Close to Monmouth University, parks, shopping, beach, and houses of worship.
Home Details
Home Type
- Single Family
Est. Annual Taxes
- $11,977
Year Built
- Built in 1964
Lot Details
- 0.4 Acre Lot
Parking
- 2 Car Attached Garage
- Driveway
Home Design
- Colonial Architecture
Interior Spaces
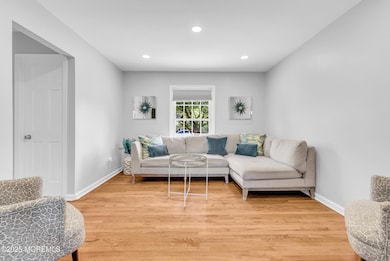
- 2,080 Sq Ft Home
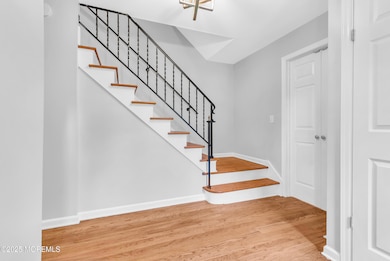
- 2-Story Property
- Basement Fills Entire Space Under The House
Bedrooms and Bathrooms
- 4 Bedrooms
Outdoor Features
- Deck
- Porch
Schools
- Frank Antonides Middle School
- Hillel High School
Utilities
- Central Air
- Baseboard Heating
- Hot Water Heating System
Listing and Financial Details
- Property Available on 9/7/26
- Ask Agent About Lease Term
- Assessor Parcel Number 53-00025-0000-00013
Map
Source: MOREMLS (Monmouth Ocean Regional REALTORS®)
MLS Number: 22529170
APN: 53-00025-0000-00013
Disclaimer: Certain information contained herein is derived from information provided by parties other than Homes.com. All information provided is deemed reliable, but is not guaranteed to be accurate and should be independently verified.
![]() IDX information is provided exclusively for personal, non-commercial use, and may not be used for any purpose other than to identify prospective properties consumers may be interested in purchasing.
IDX information is provided exclusively for personal, non-commercial use, and may not be used for any purpose other than to identify prospective properties consumers may be interested in purchasing.
Information is deemed reliable but not guaranteed.
- 57 Hollywood Ave
- 11 Fairway Ave
- 21 Dennis St
- 57 Maryland Ave
- 54 Wall St
- 489 Cedar Ave
- 369 Norwood Ave
- 120 Beechwood Ave
- 570 Monmouth Place
- 521 Cedar Ave
- 317 Norwood Ave
- 8 Norwood Ct
- 182 Wall St
- 448 Monmouth Place
- 537 Cedar Ave
- 264 Norwood Ave
- 16 Maryland Ave
- 73 Larchwood Ave
- 2 Hilltop Rd
- 497 Norwood Ave
