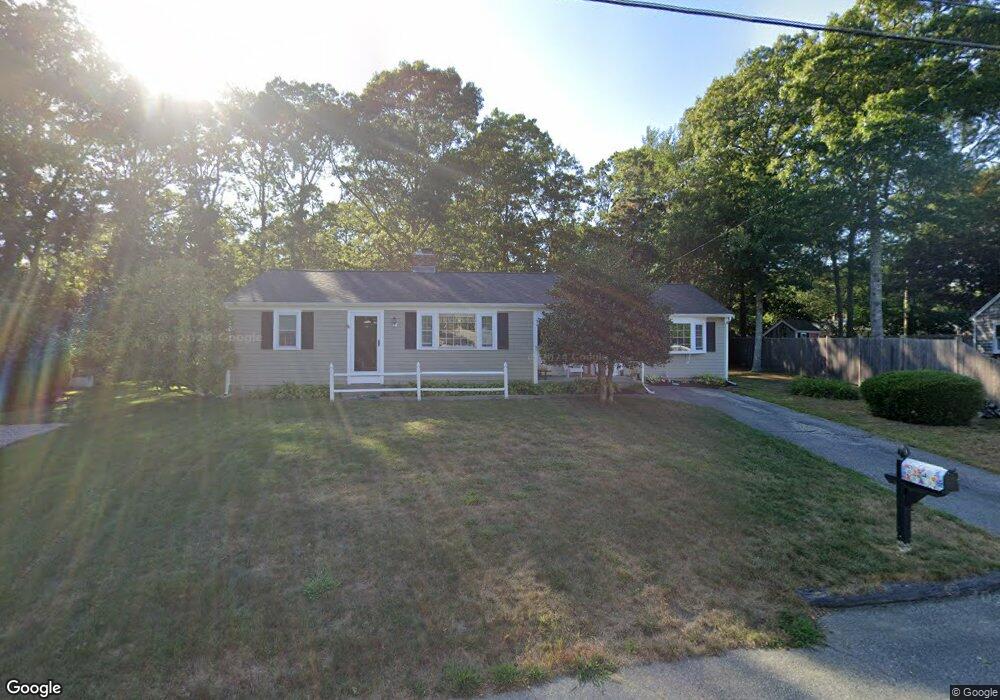
11 Pirates Way Hyannis, MA 02601
Estimated Value: $556,000 - $636,000
3
Beds
2
Baths
1,320
Sq Ft
$447/Sq Ft
Est. Value
About This Home
This home is located at 11 Pirates Way, Hyannis, MA 02601 and is currently estimated at $589,630, approximately $446 per square foot. 11 Pirates Way is a home located in Barnstable County with nearby schools including Hyannis West Elementary School, Barnstable United Elementary School, and Barnstable Intermediate School.
Ownership History
Date
Name
Owned For
Owner Type
Purchase Details
Closed on
Jan 18, 2018
Sold by
Varkas Mark and Varkas Margaret
Bought by
Varkas Ft
Current Estimated Value
Purchase Details
Closed on
Jun 21, 2004
Sold by
Kennedy John Bruce and Kennedy Lynn
Bought by
Varkas Margaret
Purchase Details
Closed on
Apr 14, 2000
Sold by
Gillespie Janet B
Bought by
Kennedy John Bruce
Home Financials for this Owner
Home Financials are based on the most recent Mortgage that was taken out on this home.
Original Mortgage
$117,600
Interest Rate
8.26%
Mortgage Type
Purchase Money Mortgage
Create a Home Valuation Report for This Property
The Home Valuation Report is an in-depth analysis detailing your home's value as well as a comparison with similar homes in the area
Home Values in the Area
Average Home Value in this Area
Purchase History
| Date | Buyer | Sale Price | Title Company |
|---|---|---|---|
| Varkas Ft | -- | -- | |
| Varkas Margaret | $285,000 | -- | |
| Kennedy John Bruce | $147,000 | -- |
Source: Public Records
Mortgage History
| Date | Status | Borrower | Loan Amount |
|---|---|---|---|
| Previous Owner | Kennedy John Bruce | $192,000 | |
| Previous Owner | Kennedy John Bruce | $117,600 |
Source: Public Records
Tax History Compared to Growth
Tax History
| Year | Tax Paid | Tax Assessment Tax Assessment Total Assessment is a certain percentage of the fair market value that is determined by local assessors to be the total taxable value of land and additions on the property. | Land | Improvement |
|---|---|---|---|---|
| 2025 | $4,552 | $491,100 | $151,300 | $339,800 |
| 2024 | $4,378 | $483,800 | $151,300 | $332,500 |
| 2023 | $4,045 | $422,700 | $137,500 | $285,200 |
| 2022 | $4,051 | $350,100 | $101,900 | $248,200 |
| 2021 | $3,628 | $304,600 | $101,900 | $202,700 |
| 2020 | $3,558 | $288,600 | $101,900 | $186,700 |
| 2019 | $3,336 | $265,200 | $101,900 | $163,300 |
| 2018 | $3,010 | $244,700 | $107,200 | $137,500 |
| 2017 | $2,851 | $237,800 | $107,200 | $130,600 |
| 2016 | $2,799 | $238,600 | $108,000 | $130,600 |
| 2015 | $2,698 | $233,200 | $104,400 | $128,800 |
Source: Public Records
Map
Nearby Homes