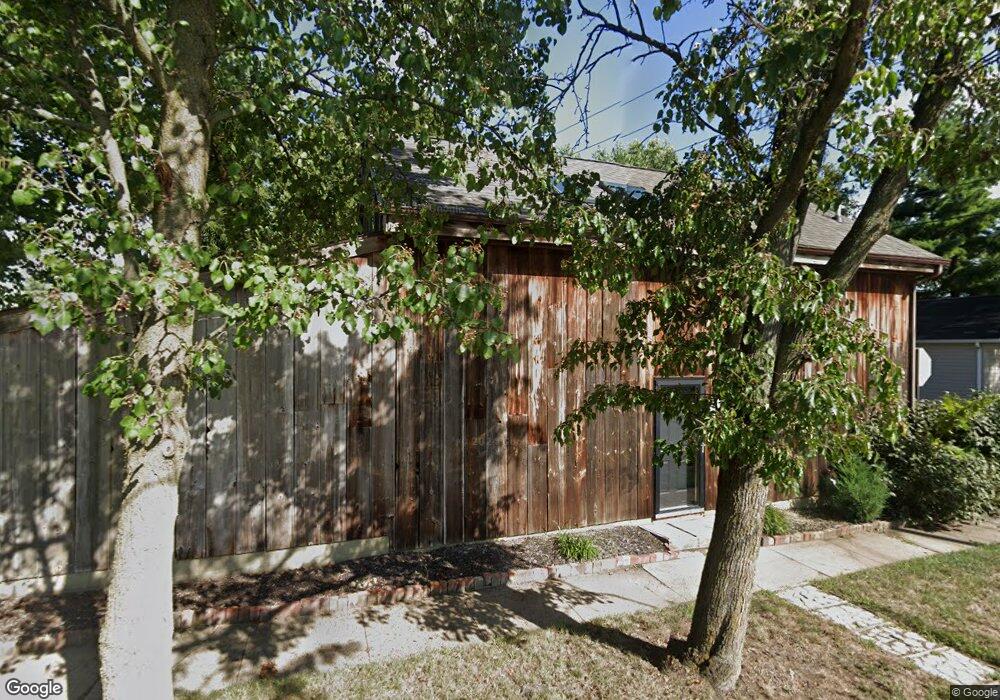
11 Plum St Lockbourne, OH 43137
Obetz-Lockbourne NeighborhoodEstimated Value: $249,000 - $329,000
3
Beds
2
Baths
1,143
Sq Ft
$243/Sq Ft
Est. Value
About This Home
This home is located at 11 Plum St, Lockbourne, OH 43137 and is currently estimated at $277,963, approximately $243 per square foot. 11 Plum St is a home located in Franklin County with nearby schools including Hamilton Elementary School, Hamilton Intermediate School, and Hamilton Middle School.
Ownership History
Date
Name
Owned For
Owner Type
Purchase Details
Closed on
Aug 5, 2015
Sold by
Lambert Jeffrey
Bought by
Witting Scott
Current Estimated Value
Purchase Details
Closed on
Jun 19, 2015
Sold by
Doughman Kenneth R and Griffith Linsey
Bought by
Lambert Jeffrey
Purchase Details
Closed on
Jan 28, 2006
Sold by
Estep Marti G
Bought by
Doughman Kenneth R and Griffith Linsey
Home Financials for this Owner
Home Financials are based on the most recent Mortgage that was taken out on this home.
Original Mortgage
$102,400
Interest Rate
6.37%
Mortgage Type
Fannie Mae Freddie Mac
Purchase Details
Closed on
Jan 24, 2002
Sold by
Nesser John P and Nesser Donna C
Bought by
Estep Marti G
Home Financials for this Owner
Home Financials are based on the most recent Mortgage that was taken out on this home.
Original Mortgage
$97,000
Interest Rate
7.23%
Purchase Details
Closed on
Nov 25, 1981
Bought by
Nesser John P and Nesser Donna C
Create a Home Valuation Report for This Property
The Home Valuation Report is an in-depth analysis detailing your home's value as well as a comparison with similar homes in the area
Home Values in the Area
Average Home Value in this Area
Purchase History
| Date | Buyer | Sale Price | Title Company |
|---|---|---|---|
| Witting Scott | $37,200 | Valmer Title | |
| Lambert Jeffrey | $25,000 | Valmer Land Title Agency Box | |
| Doughman Kenneth R | $128,000 | Nordic Titl | |
| Estep Marti G | $122,000 | -- | |
| Nesser John P | -- | -- |
Source: Public Records
Mortgage History
| Date | Status | Borrower | Loan Amount |
|---|---|---|---|
| Previous Owner | Doughman Kenneth R | $102,400 | |
| Previous Owner | Estep Marti G | $97,000 |
Source: Public Records
Tax History Compared to Growth
Tax History
| Year | Tax Paid | Tax Assessment Tax Assessment Total Assessment is a certain percentage of the fair market value that is determined by local assessors to be the total taxable value of land and additions on the property. | Land | Improvement |
|---|---|---|---|---|
| 2024 | $2,591 | $52,860 | $20,550 | $32,310 |
| 2023 | $2,553 | $52,850 | $20,545 | $32,305 |
| 2022 | $1,889 | $33,190 | $8,440 | $24,750 |
| 2021 | $1,914 | $33,190 | $8,440 | $24,750 |
| 2020 | $1,949 | $33,190 | $8,440 | $24,750 |
| 2019 | $1,824 | $27,660 | $7,040 | $20,620 |
| 2018 | $1,839 | $27,660 | $7,040 | $20,620 |
| 2017 | $1,876 | $27,660 | $7,040 | $20,620 |
| 2016 | $1,997 | $29,090 | $5,220 | $23,870 |
| 2015 | $1,848 | $29,090 | $5,220 | $23,870 |
| 2014 | $1,839 | $29,090 | $5,220 | $23,870 |
| 2013 | $1,089 | $32,340 | $5,810 | $26,530 |
Source: Public Records
Map
Nearby Homes
- 85 Landis St
- 37 Commerce St
- 10610 E State Route 762
- 10610 E State Route 762 Unit Lot 82B
- 10610 E State Route 762 Unit Lot 72
- 6515 S High St
- 10874 Bulen Pierce Rd
- 10910 Bulen Pierce Rd
- 4 Oak Rd Unit 4
- 47 Cottage St
- 10942 Bulen Pierce Rd
- 10976 Bulen Pierce Rd
- 2864 W Old Duvall Ct
- 2713 W Old Duvall Ct
- 2767 W Old Duvall Ct
- 2901 W Old Duvall Ct
- 6635 Alum Creek Dr
- 10555 Lockbourne Eastern Rd
- 1448 Rohr Rd
- 11048 Ashville Pike
- 11 Plumb St
- 17 Plumb St
- 17 Plum St
- 116 Commercial Dr
- 55 Commerce St Unit 57
- 144 Commercial Dr
- 210 Commercial Dr
- 131 Commercial Dr
- 19 Plum St
- 148 Plumb St
- 114 Mechanics St
- 26 Commerce St
- 78 Commerce St
- 80 Commerce St
- 136 Mechanics St
- 109 Commerce St
- 140 Mechanics St
- 157 Commercial Dr
- 128 Commercial Dr
- 135 Commerce St