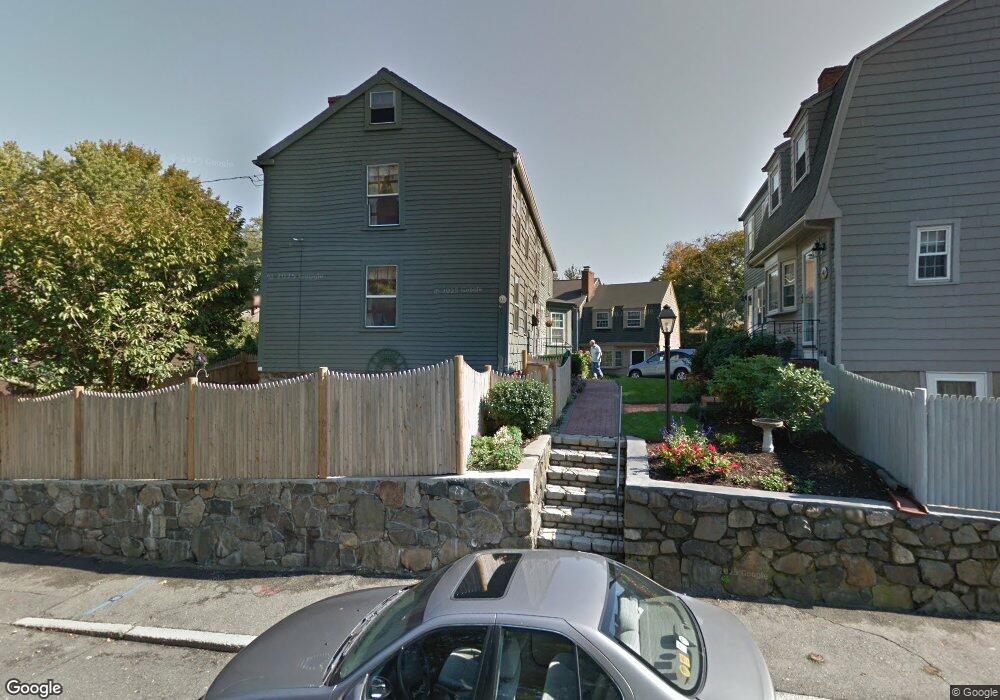
11 Pond St Marblehead, MA 01945
Estimated Value: $638,000 - $672,933
3
Beds
1
Bath
950
Sq Ft
$692/Sq Ft
Est. Value
About This Home
This home is located at 11 Pond St, Marblehead, MA 01945 and is currently estimated at $656,983, approximately $691 per square foot. 11 Pond St is a home located in Essex County with nearby schools including Marblehead High School, Marblehead Community Charter Public School, and Devereux School.
Ownership History
Date
Name
Owned For
Owner Type
Purchase Details
Closed on
Nov 22, 2010
Sold by
Remington Anne B
Bought by
Remington Anne B and Levy Karen L
Current Estimated Value
Purchase Details
Closed on
Nov 28, 1994
Sold by
Murray Gail K
Bought by
Remington Anne B
Create a Home Valuation Report for This Property
The Home Valuation Report is an in-depth analysis detailing your home's value as well as a comparison with similar homes in the area
Home Values in the Area
Average Home Value in this Area
Purchase History
| Date | Buyer | Sale Price | Title Company |
|---|---|---|---|
| Remington Anne B | -- | -- | |
| Remington Anne B | -- | -- | |
| Remington Anne B | $123,000 | -- | |
| Remington Anne B | $123,000 | -- |
Source: Public Records
Mortgage History
| Date | Status | Borrower | Loan Amount |
|---|---|---|---|
| Previous Owner | Remington Anne B | $50,000 | |
| Previous Owner | Remington Anne B | $75,000 | |
| Previous Owner | Remington Anne B | $50,000 |
Source: Public Records
Tax History Compared to Growth
Tax History
| Year | Tax Paid | Tax Assessment Tax Assessment Total Assessment is a certain percentage of the fair market value that is determined by local assessors to be the total taxable value of land and additions on the property. | Land | Improvement |
|---|---|---|---|---|
| 2025 | $4,685 | $517,700 | $343,100 | $174,600 |
| 2024 | $4,721 | $526,900 | $365,000 | $161,900 |
| 2023 | $4,494 | $449,400 | $321,200 | $128,200 |
| 2022 | $4,356 | $414,100 | $277,400 | $136,700 |
| 2021 | $4,087 | $392,200 | $255,500 | $136,700 |
| 2020 | $3,812 | $366,900 | $255,500 | $111,400 |
| 2019 | $3,784 | $352,300 | $240,900 | $111,400 |
| 2018 | $3,641 | $330,400 | $219,000 | $111,400 |
| 2017 | $3,557 | $323,100 | $211,700 | $111,400 |
| 2016 | $3,505 | $315,800 | $204,400 | $111,400 |
| 2015 | $3,198 | $288,600 | $182,500 | $106,100 |
| 2014 | $3,089 | $278,500 | $175,200 | $103,300 |
Source: Public Records
Map
Nearby Homes
- 3 Frost Ln Unit 1
- 20 Mechanic Square Unit 3
- 20 Mechanic Square Unit 2
- 7 Mechanic Ct
- 45 Pleasant St
- 24 Russell St
- 132 Elm St
- 132 Elm St Unit 132
- 134 Elm St
- 29 High St
- 66 Pleasant St Unit 1
- 66 Pleasant St Unit 2
- 7 Lee St Unit 3
- 102 Front St Unit 1
- 75 Pond St
- 51 Lincoln Ave
- 290 Washington St Unit 1
- 15 Lindsey St
- 55 Brackett Place Unit B
- 66 Jersey St