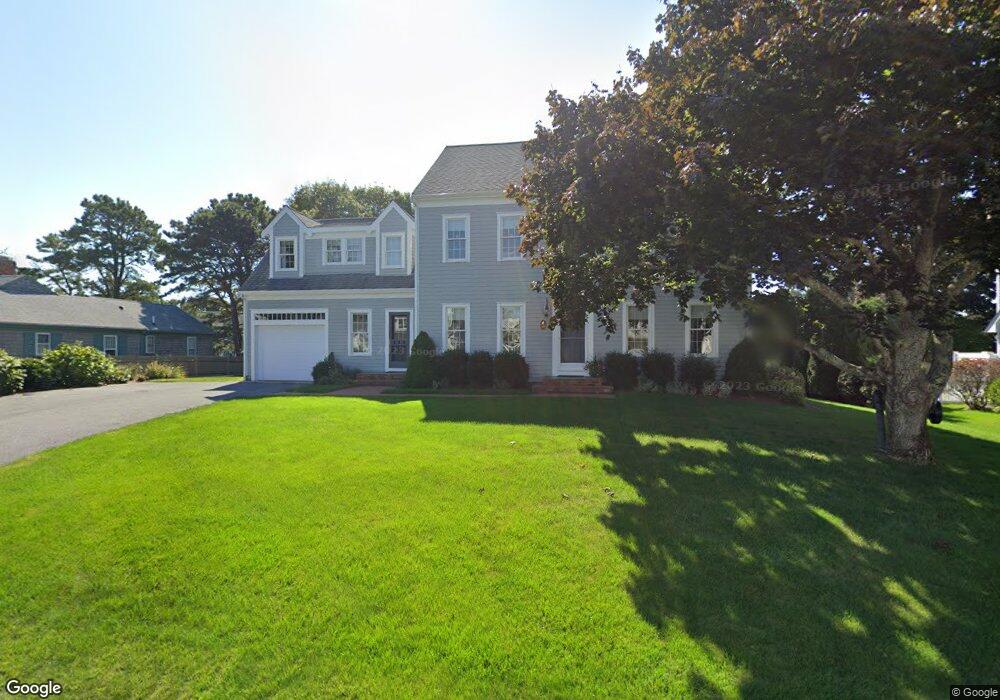
11 Porter Ln West Dennis, MA 02670
West Dennis NeighborhoodEstimated Value: $1,518,000 - $1,994,000
3
Beds
3
Baths
3,251
Sq Ft
$543/Sq Ft
Est. Value
About This Home
This home is located at 11 Porter Ln, West Dennis, MA 02670 and is currently estimated at $1,764,355, approximately $542 per square foot. 11 Porter Ln is a home located in Barnstable County with nearby schools including Dennis-Yarmouth Regional High School and St. Pius X. School.
Ownership History
Date
Name
Owned For
Owner Type
Purchase Details
Closed on
Jun 18, 1990
Sold by
Oconnell Gregory M
Bought by
Yamartino Stephen J
Current Estimated Value
Home Financials for this Owner
Home Financials are based on the most recent Mortgage that was taken out on this home.
Original Mortgage
$115,000
Interest Rate
10.54%
Mortgage Type
Purchase Money Mortgage
Create a Home Valuation Report for This Property
The Home Valuation Report is an in-depth analysis detailing your home's value as well as a comparison with similar homes in the area
Home Values in the Area
Average Home Value in this Area
Purchase History
| Date | Buyer | Sale Price | Title Company |
|---|---|---|---|
| Yamartino Stephen J | $233,000 | -- |
Source: Public Records
Mortgage History
| Date | Status | Borrower | Loan Amount |
|---|---|---|---|
| Open | Yamartino Stephen J | $290,000 | |
| Closed | Yamartino Stephen J | $297,000 | |
| Closed | Yamartino Stephen J | $115,000 |
Source: Public Records
Tax History Compared to Growth
Tax History
| Year | Tax Paid | Tax Assessment Tax Assessment Total Assessment is a certain percentage of the fair market value that is determined by local assessors to be the total taxable value of land and additions on the property. | Land | Improvement |
|---|---|---|---|---|
| 2025 | $6,491 | $1,499,000 | $527,200 | $971,800 |
| 2024 | $6,724 | $1,531,700 | $507,000 | $1,024,700 |
| 2023 | $6,552 | $1,403,000 | $460,900 | $942,100 |
| 2022 | $6,070 | $1,084,000 | $373,700 | $710,300 |
| 2021 | $7,302 | $981,800 | $366,300 | $615,500 |
| 2020 | $5,533 | $907,000 | $348,900 | $558,100 |
| 2019 | $5,502 | $891,800 | $342,100 | $549,700 |
| 2018 | $6,156 | $808,200 | $325,600 | $482,600 |
| 2017 | $6,096 | $808,300 | $325,700 | $482,600 |
| 2016 | $4,879 | $747,200 | $341,900 | $405,300 |
| 2015 | $4,541 | $709,600 | $341,900 | $367,700 |
| 2014 | $4,496 | $708,100 | $314,800 | $393,300 |
Source: Public Records
Map
Nearby Homes
- 2 Rita Mary Way
- 181 Pleasant St
- 14 Schoolhouse Ln
- 308 Old Main St
- 209 Main St Unit 3
- 209 Main St Unit 6
- 209 Main St Unit 1
- 209 Main St Unit 2
- 209 Main St Unit 4
- 209 Main St Unit 5
- 745 Willow St
- 178 School St
- 45 Seth Ln
- 40 Kelley Rd
- 23 Doric Ave
- 22 Powhatan Rd
- 17 South St
- 29 Bass River Rd
- 15 Sharon Rd
- 401 Main St Unit 201