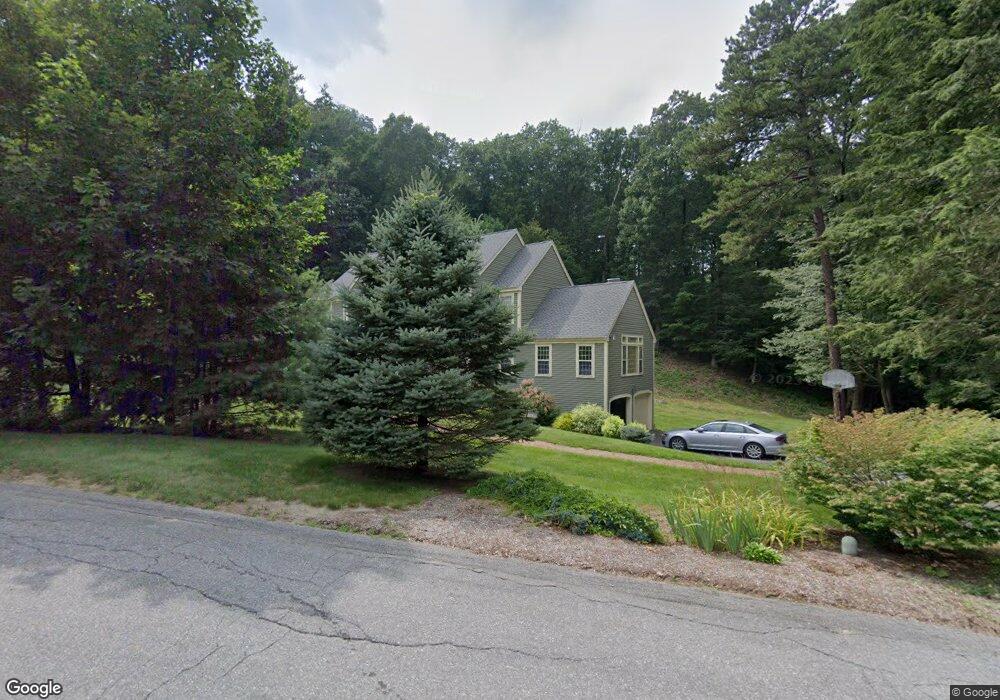
11 Priest Rd Berlin, MA 01503
Estimated Value: $878,777 - $986,000
4
Beds
3
Baths
3,093
Sq Ft
$309/Sq Ft
Est. Value
About This Home
This home is located at 11 Priest Rd, Berlin, MA 01503 and is currently estimated at $956,194, approximately $309 per square foot. 11 Priest Rd is a home located in Worcester County with nearby schools including Tahanto Regional High School.
Ownership History
Date
Name
Owned For
Owner Type
Purchase Details
Closed on
Oct 30, 2025
Sold by
Martel Diane M and Solera John J
Bought by
Solera Martel Ft and Martel
Current Estimated Value
Purchase Details
Closed on
Jul 10, 1991
Sold by
Orchard Hill Construct
Bought by
Martel Diane M and Solera John J
Home Financials for this Owner
Home Financials are based on the most recent Mortgage that was taken out on this home.
Original Mortgage
$100,000
Interest Rate
9.35%
Mortgage Type
Purchase Money Mortgage
Create a Home Valuation Report for This Property
The Home Valuation Report is an in-depth analysis detailing your home's value as well as a comparison with similar homes in the area
Home Values in the Area
Average Home Value in this Area
Purchase History
| Date | Buyer | Sale Price | Title Company |
|---|---|---|---|
| Solera Martel Ft | -- | -- | |
| Martel Diane M | $305,000 | -- | |
| Construct Orchard Hill | $60,000 | -- |
Source: Public Records
Mortgage History
| Date | Status | Borrower | Loan Amount |
|---|---|---|---|
| Previous Owner | Construct Orchard Hill | $20,000 | |
| Previous Owner | Construct Orchard Hill | $88,000 | |
| Previous Owner | Construct Orchard Hill | $100,000 |
Source: Public Records
Tax History
| Year | Tax Paid | Tax Assessment Tax Assessment Total Assessment is a certain percentage of the fair market value that is determined by local assessors to be the total taxable value of land and additions on the property. | Land | Improvement |
|---|---|---|---|---|
| 2025 | $112 | $787,400 | $287,800 | $499,600 |
| 2024 | $10,039 | $787,400 | $287,800 | $499,600 |
| 2023 | $9,169 | $662,500 | $249,900 | $412,600 |
| 2022 | $8,765 | $560,800 | $209,600 | $351,200 |
| 2021 | $8,416 | $540,200 | $199,200 | $341,000 |
| 2020 | $8,304 | $525,900 | $184,900 | $341,000 |
| 2019 | $4,124 | $519,100 | $184,900 | $334,200 |
| 2018 | $7,266 | $497,700 | $173,200 | $324,500 |
| 2017 | $8,104 | $511,300 | $176,300 | $335,000 |
| 2016 | $7,578 | $477,200 | $157,500 | $319,700 |
| 2015 | $7,278 | $452,300 | $150,000 | $302,300 |
| 2014 | $7,540 | $452,300 | $150,000 | $302,300 |
Source: Public Records
Map
Nearby Homes
- 343 Newton St
- 75 Newton St
- 244 Crosby Rd
- 18 Alden Dr Unit 3
- 210 Green St
- 56 Carter St
- 429 Howard St
- 122 Green St
- 245 Brewer St
- 460 Whitney St
- 190 Mile Hill Rd
- 1A Mentzer Ave
- 831 Ledgewood Way
- 843 Ledgewood Way
- 839 Ledgewood Way
- 26 Treetop Cir
- 1221 Hazelwood Way Unit 1221
- 404 Fernwood Ln Unit 404
- 15 Dunia Ln Unit 15
- 146 Randall Rd
Your Personal Tour Guide
Ask me questions while you tour the home.