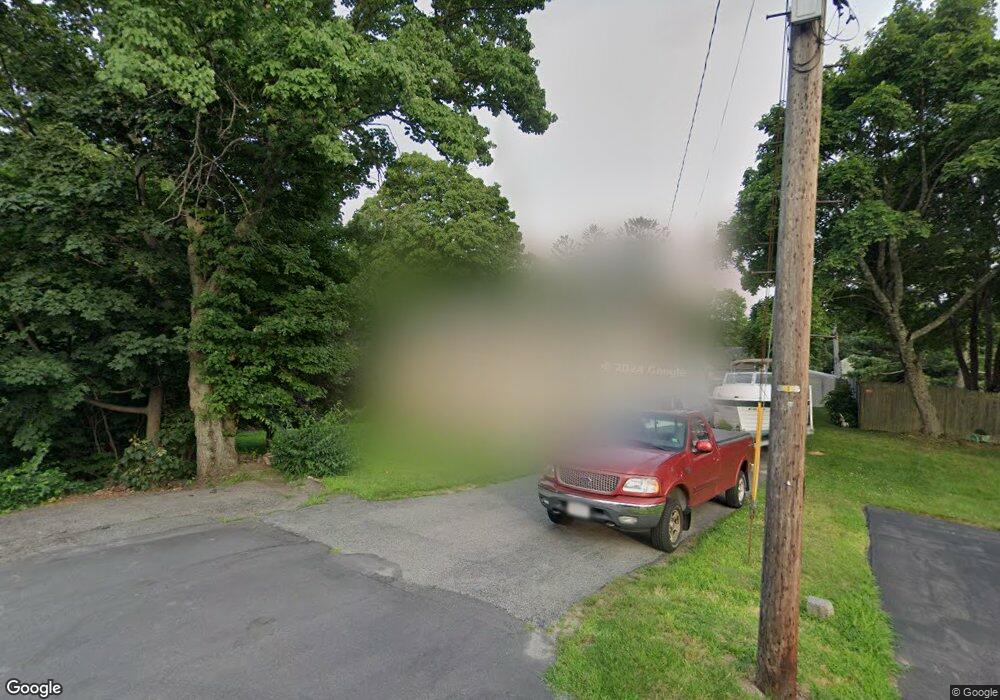
11 Prospect St Braintree, MA 02184
East Braintree NeighborhoodEstimated Value: $689,000 - $728,000
3
Beds
3
Baths
1,424
Sq Ft
$497/Sq Ft
Est. Value
About This Home
This home is located at 11 Prospect St, Braintree, MA 02184 and is currently estimated at $708,261, approximately $497 per square foot. 11 Prospect St is a home located in Norfolk County with nearby schools including Braintree High School, Sacred Heart Elementary School, and South Shore Christian Academy.
Ownership History
Date
Name
Owned For
Owner Type
Purchase Details
Closed on
Feb 21, 2025
Sold by
Carabin Rt and Carabin
Bought by
Komry John and Komry Sierra
Current Estimated Value
Home Financials for this Owner
Home Financials are based on the most recent Mortgage that was taken out on this home.
Original Mortgage
$646,000
Outstanding Balance
$641,748
Interest Rate
6.38%
Mortgage Type
Purchase Money Mortgage
Estimated Equity
$66,513
Purchase Details
Closed on
May 13, 2024
Sold by
Carabin Louis J and Carabin Susan
Bought by
Carabin Rt and Carabin
Purchase Details
Closed on
Feb 26, 2013
Sold by
Carabin Louis J and Hassan Susan
Bought by
Carabin Louis J and Carabin Susan
Home Financials for this Owner
Home Financials are based on the most recent Mortgage that was taken out on this home.
Original Mortgage
$235,000
Interest Rate
3.44%
Mortgage Type
New Conventional
Create a Home Valuation Report for This Property
The Home Valuation Report is an in-depth analysis detailing your home's value as well as a comparison with similar homes in the area
Home Values in the Area
Average Home Value in this Area
Purchase History
| Date | Buyer | Sale Price | Title Company |
|---|---|---|---|
| Komry John | $680,000 | None Available | |
| Carabin Rt | -- | None Available | |
| Carabin Rt | -- | None Available | |
| Carabin Louis J | -- | -- | |
| Carabin Louis J | -- | -- |
Source: Public Records
Mortgage History
| Date | Status | Borrower | Loan Amount |
|---|---|---|---|
| Open | Komry John | $646,000 | |
| Previous Owner | Carabin Louis J | $235,000 |
Source: Public Records
Tax History
| Year | Tax Paid | Tax Assessment Tax Assessment Total Assessment is a certain percentage of the fair market value that is determined by local assessors to be the total taxable value of land and additions on the property. | Land | Improvement |
|---|---|---|---|---|
| 2025 | $5,898 | $591,000 | $362,000 | $229,000 |
| 2024 | $5,276 | $556,500 | $337,600 | $218,900 |
| 2023 | $4,966 | $508,800 | $303,300 | $205,500 |
| 2022 | $4,771 | $479,500 | $274,000 | $205,500 |
| 2021 | $4,443 | $446,500 | $247,600 | $198,900 |
| 2020 | $4,181 | $424,000 | $225,100 | $198,900 |
| 2019 | $3,981 | $394,500 | $215,300 | $179,200 |
| 2018 | $3,867 | $366,900 | $195,700 | $171,200 |
| 2017 | $3,734 | $347,700 | $185,900 | $161,800 |
| 2016 | $3,438 | $313,100 | $156,600 | $156,500 |
| 2015 | $3,428 | $309,700 | $154,600 | $155,100 |
| 2014 | $3,178 | $278,300 | $140,900 | $137,400 |
Source: Public Records
Map
Nearby Homes
- 26 Tingley Rd
- 300 Commercial St Unit 23
- 312 Shaw St
- 54 Edgemont Rd
- 41 Lantern Ln
- 37 Lantern Ln
- 16 Beechwood Rd
- 30 Skyline Dr Unit 6
- 37 Skyline Dr Unit 11
- 122 Washington St Unit Twenty-two
- 255 River St
- 11 Richmond St
- 25 Richmond St
- 25 W Howard St Unit C3
- 15 Summer St
- 342 Elm St
- 50 Cleveland Ave
- 36 Chestnut Ave
- 19 Vine St Unit 3
- 19 Vine St Unit 2
Your Personal Tour Guide
Ask me questions while you tour the home.