R
Seller's Agent in 2018
Rick Stone
Today Real Estate
Estimated Value: $603,000 - $799,000
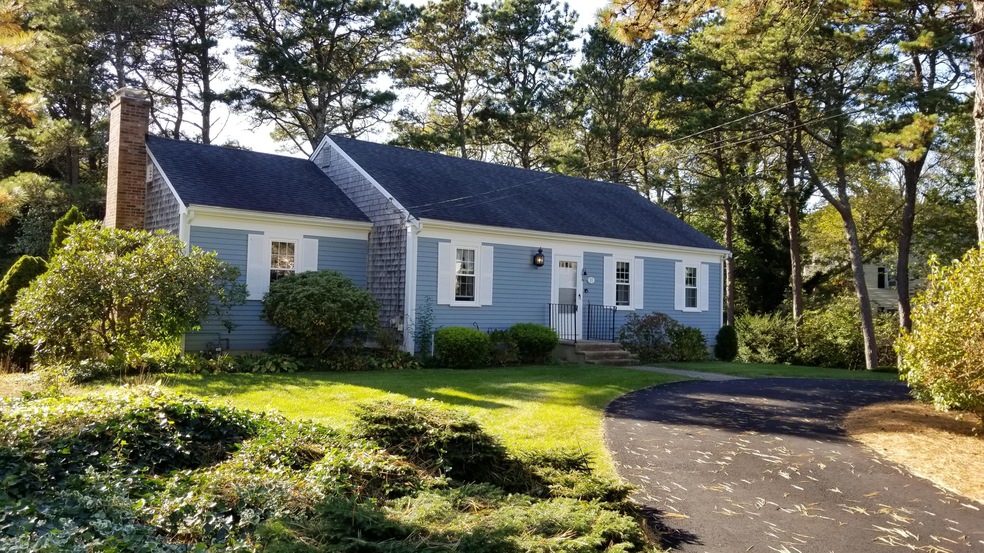
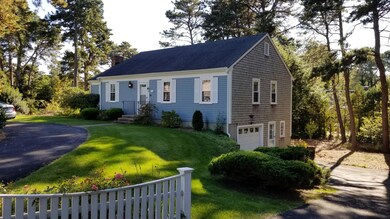
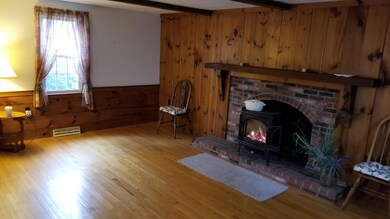
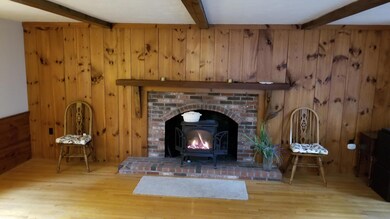
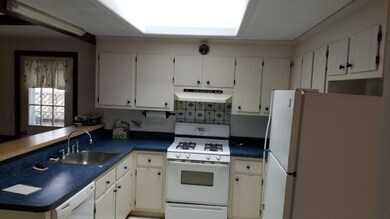
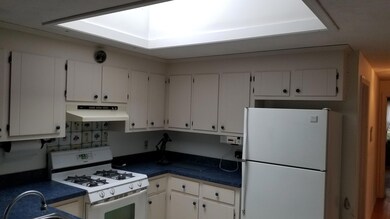
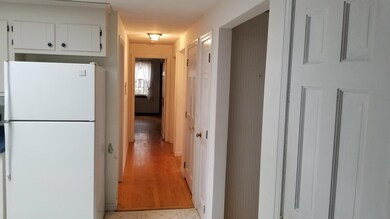
Fantastic buy in sought-after neighborhood in Yarmouthport! Great 2BR 1.5BA ranch with many updates. New heat, ac, windows, newer roof, hardwood throughout, huge bedrooms, gas fireplace stove, walkout basement, drive under garage and a circular drive in front. Beautiful yard. A must see!
Last Agent to Sell the Property
Rick Stone
Today Real Estate License #9537502 Listed on: 10/24/2017
Last Buyer's Agent
Anne Cave
Today Real Estate
| Date | Buyer | Sale Price | Title Company |
|---|---|---|---|
| Catelli Albert | $315,000 | -- | |
| Garofano Lena M | $120,000 | -- |
| Date | Status | Borrower | Loan Amount |
|---|---|---|---|
| Open | Catelli Albert | $110,000 |
| Date | Event | Price | List to Sale | Price per Sq Ft |
|---|---|---|---|---|
| 01/12/2018 01/12/18 | Sold | $315,000 | -3.1% | $248 / Sq Ft |
| 12/28/2017 12/28/17 | Pending | -- | -- | -- |
| 10/24/2017 10/24/17 | For Sale | $325,000 | -- | $256 / Sq Ft |
| Year | Tax Paid | Tax Assessment Tax Assessment Total Assessment is a certain percentage of the fair market value that is determined by local assessors to be the total taxable value of land and additions on the property. | Land | Improvement |
|---|---|---|---|---|
| 2025 | $4,406 | $622,300 | $192,800 | $429,500 |
| 2024 | $4,019 | $544,600 | $150,200 | $394,400 |
| 2023 | $3,890 | $479,600 | $132,500 | $347,100 |
| 2022 | $3,638 | $396,300 | $120,400 | $275,900 |
| 2021 | $3,441 | $359,900 | $126,400 | $233,500 |
| 2020 | $3,417 | $341,700 | $133,700 | $208,000 |
| 2019 | $3,143 | $311,200 | $133,700 | $177,500 |
| 2018 | $2,925 | $284,300 | $111,500 | $172,800 |
| 2017 | $2,849 | $284,300 | $111,500 | $172,800 |
| 2016 | $2,747 | $275,300 | $102,500 | $172,800 |
| 2015 | $2,495 | $248,500 | $91,800 | $156,700 |
R
Seller's Agent in 2018
Rick Stone
Today Real Estate
A
Buyer's Agent in 2018
Anne Cave
Today Real Estate
Source: Cape Cod & Islands Association of REALTORS®
MLS Number: 21716692
APN: YARM-000114-000014
Disclaimer: Certain information contained herein is derived from information provided by parties other than Homes.com. All information provided is deemed reliable, but is not guaranteed to be accurate and should be independently verified.
![]() All data relating to real estate for sale on this page comes from the Broker Reciprocity (BR) of the Cape Cod & Islands Multiple Listing Service, Inc. Detailed information about real estate listings held by brokerage firms other than CC&I Assoc. of REALTORS®, Inc. includes the name of the listing company. Neither the listing company nor CC&I Assoc. of REALTORS®, Inc. shall be responsible for any typographical errors, misinformation, misprints and shall be held totally harmless. The Broker providing this data believes it to be correct, but advises interested parties to confirm any item before relying on it in a purchase decision. All properties are subject to prior sale, changes, or withdrawal. Copyright 2025 © Cape Cod & Islands Multiple Listing Service, Inc. All rights reserved.
All data relating to real estate for sale on this page comes from the Broker Reciprocity (BR) of the Cape Cod & Islands Multiple Listing Service, Inc. Detailed information about real estate listings held by brokerage firms other than CC&I Assoc. of REALTORS®, Inc. includes the name of the listing company. Neither the listing company nor CC&I Assoc. of REALTORS®, Inc. shall be responsible for any typographical errors, misinformation, misprints and shall be held totally harmless. The Broker providing this data believes it to be correct, but advises interested parties to confirm any item before relying on it in a purchase decision. All properties are subject to prior sale, changes, or withdrawal. Copyright 2025 © Cape Cod & Islands Multiple Listing Service, Inc. All rights reserved.
