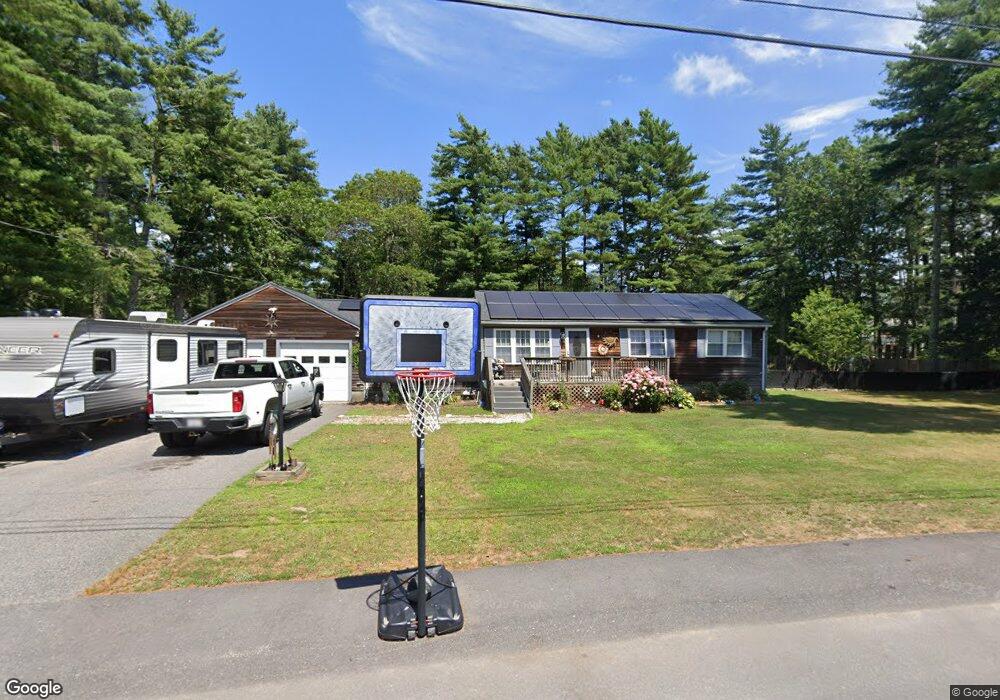
11 Ransom St Carver, MA 02330
Estimated Value: $538,000 - $574,000
3
Beds
2
Baths
960
Sq Ft
$582/Sq Ft
Est. Value
About This Home
This home is located at 11 Ransom St, Carver, MA 02330 and is currently estimated at $558,577, approximately $581 per square foot. 11 Ransom St is a home located in Plymouth County with nearby schools including Carver Elementary School, Carver Middle/High School, and Samuel Fuller School.
Ownership History
Date
Name
Owned For
Owner Type
Purchase Details
Closed on
Apr 28, 2006
Sold by
Mcelroy James M and Mcelroy Denise H
Bought by
Pelletier James A and Pelletier Jeanette M
Current Estimated Value
Home Financials for this Owner
Home Financials are based on the most recent Mortgage that was taken out on this home.
Original Mortgage
$248,000
Outstanding Balance
$143,631
Interest Rate
6.4%
Mortgage Type
Purchase Money Mortgage
Estimated Equity
$414,946
Purchase Details
Closed on
Aug 31, 2000
Sold by
Landrau Kimberly A
Bought by
Mcelroy Denise H and Mcelroy James M
Purchase Details
Closed on
Sep 29, 1995
Sold by
Zarras Vissarion
Bought by
Landrau Kimberly A
Purchase Details
Closed on
Dec 29, 1987
Sold by
Ezersky Lynda M
Bought by
Zarras Vissarion
Create a Home Valuation Report for This Property
The Home Valuation Report is an in-depth analysis detailing your home's value as well as a comparison with similar homes in the area
Home Values in the Area
Average Home Value in this Area
Purchase History
We collect this data history from publicly available records. To have your information removed, we recommend requesting removal directly through your county’s website.
| Date | Buyer | Sale Price | Title Company |
|---|---|---|---|
| Pelletier James A | $310,000 | -- | |
| Mcelroy Denise H | $150,000 | -- | |
| Landrau Kimberly A | $99,645 | -- | |
| Zarras Vissarion | $122,000 | -- |
Source: Public Records
Mortgage History
We collect this data history from publicly available records. To have your information removed, we recommend requesting removal directly through your county’s website.
| Date | Status | Borrower | Loan Amount |
|---|---|---|---|
| Open | Zarras Vissarion | $248,000 | |
| Previous Owner | Zarras Vissarion | $160,000 | |
| Previous Owner | Zarras Vissarion | $142,500 |
Source: Public Records
Tax History
| Year | Tax Paid | Tax Assessment Tax Assessment Total Assessment is a certain percentage of the fair market value that is determined by local assessors to be the total taxable value of land and additions on the property. | Land | Improvement |
|---|---|---|---|---|
| 2025 | $6,784 | $489,100 | $135,200 | $353,900 |
| 2024 | $6,256 | $441,500 | $132,500 | $309,000 |
| 2023 | $6,018 | $412,500 | $132,500 | $280,000 |
| 2022 | $5,667 | $354,600 | $113,300 | $241,300 |
| 2021 | $5,285 | $312,000 | $101,200 | $210,800 |
| 2020 | $5,030 | $292,600 | $94,600 | $198,000 |
| 2019 | $4,892 | $286,900 | $91,800 | $195,100 |
| 2018 | $4,575 | $259,500 | $91,800 | $167,700 |
| 2017 | $4,408 | $249,200 | $88,300 | $160,900 |
| 2016 | $4,055 | $238,100 | $84,100 | $154,000 |
| 2015 | $3,849 | $226,300 | $84,100 | $142,200 |
| 2014 | $3,810 | $224,000 | $106,400 | $117,600 |
Source: Public Records
Map
Nearby Homes
- 67 Fosdick Rd
- 79 Crystal Lake Dr
- 35 Silva St
- 0 Fuller St Unit 73525385
- 11 Brockton Ave
- 147 Plymouth St
- Lot1 Elk Run Dr
- 77 Center St
- 235 Main St
- 15 Carver Square Blvd Unit 15
- 15 Carver Square Blvd
- 64 Rocky Meadow St
- 38 Popes Point Rd
- 7 Bisbee Dr
- 269 Tispaquin St
- 81 S Meadow Rd
- 2 Commons Dr
- 3 Kestrel Way
- 13 Pond View Way
- 5 Brook St
Your Personal Tour Guide
Ask me questions while you tour the home.