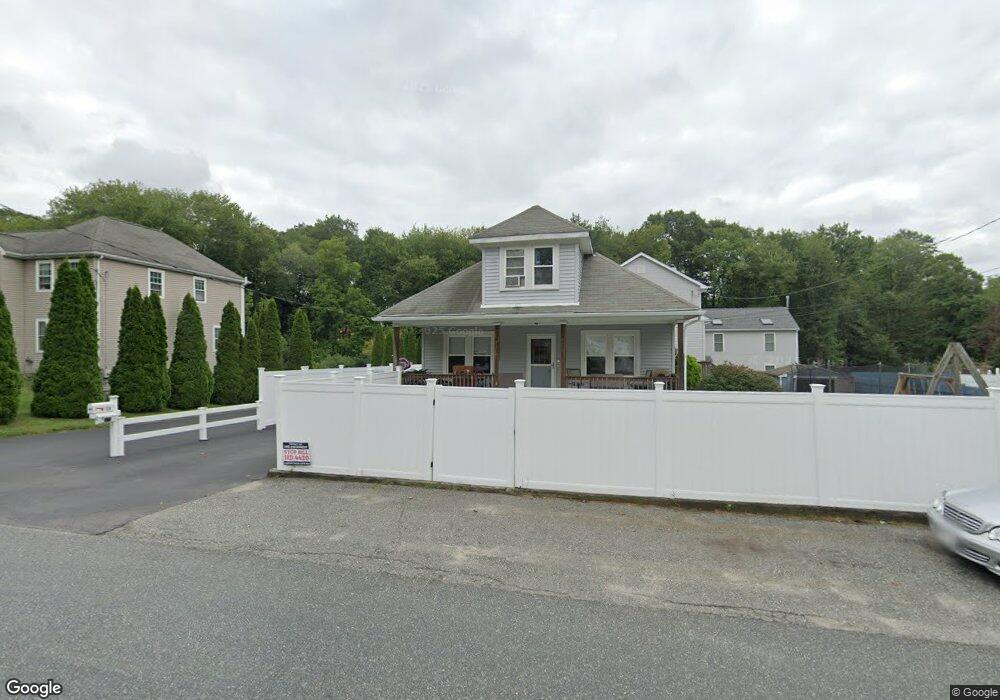
11 Raymond Marchetti St Ashland, MA 01721
Estimated Value: $524,000 - $627,000
3
Beds
2
Baths
1,922
Sq Ft
$290/Sq Ft
Est. Value
About This Home
This home is located at 11 Raymond Marchetti St, Ashland, MA 01721 and is currently estimated at $556,733, approximately $289 per square foot. 11 Raymond Marchetti St is a home located in Middlesex County with nearby schools including William Pittaway Elementary School, David Mindess Elementary School, and Henry E. Warren Elementary School.
Ownership History
Date
Name
Owned For
Owner Type
Purchase Details
Closed on
Jun 17, 2011
Sold by
Magri John C and Magri John J
Bought by
Magri John J and Magri Leslie
Current Estimated Value
Purchase Details
Closed on
May 12, 2009
Sold by
Lelievre Napoleon
Bought by
Magri John C and Magri Lisa M
Purchase Details
Closed on
Aug 13, 2008
Sold by
Magalhaes Carmen and Gmac Mortgage Llc
Bought by
Gmac Mortgage Llc
Purchase Details
Closed on
Dec 23, 2004
Sold by
Magri Karen M and Magri Steven
Bought by
Magalhaes Carmen and Magalhaes Olavo
Home Financials for this Owner
Home Financials are based on the most recent Mortgage that was taken out on this home.
Original Mortgage
$252,000
Interest Rate
5.74%
Mortgage Type
Purchase Money Mortgage
Purchase Details
Closed on
Sep 26, 1990
Sold by
Morazzini Elda L
Bought by
Magri Steven E
Create a Home Valuation Report for This Property
The Home Valuation Report is an in-depth analysis detailing your home's value as well as a comparison with similar homes in the area
Home Values in the Area
Average Home Value in this Area
Purchase History
| Date | Buyer | Sale Price | Title Company |
|---|---|---|---|
| Magri John J | -- | -- | |
| Magri John C | -- | -- | |
| Lelievre Napoleon | $190,000 | -- | |
| Gmac Mortgage Llc | $260,910 | -- | |
| Magalhaes Carmen | $315,000 | -- | |
| Magri Steven E | $145,000 | -- |
Source: Public Records
Mortgage History
| Date | Status | Borrower | Loan Amount |
|---|---|---|---|
| Open | Magri Steven E | $197,455 | |
| Previous Owner | Magalhaes Carmen | $252,000 | |
| Previous Owner | Magri Steven E | $292,000 |
Source: Public Records
Tax History Compared to Growth
Tax History
| Year | Tax Paid | Tax Assessment Tax Assessment Total Assessment is a certain percentage of the fair market value that is determined by local assessors to be the total taxable value of land and additions on the property. | Land | Improvement |
|---|---|---|---|---|
| 2025 | $5,707 | $446,900 | $0 | $446,900 |
| 2024 | $5,705 | $430,900 | $0 | $430,900 |
| 2023 | $5,450 | $395,800 | $0 | $395,800 |
| 2022 | $5,830 | $367,100 | $0 | $367,100 |
| 2021 | $5,542 | $347,928 | $0 | $347,928 |
| 2020 | $5,469 | $338,400 | $0 | $338,400 |
| 2019 | $5,301 | $325,600 | $0 | $325,600 |
| 2018 | $5,196 | $312,800 | $0 | $312,800 |
| 2017 | $5,063 | $303,200 | $0 | $303,200 |
| 2016 | $4,993 | $293,700 | $0 | $293,700 |
| 2015 | $4,970 | $287,280 | $0 | $287,280 |
| 2014 | $4,885 | $280,900 | $0 | $280,900 |
Source: Public Records
Map
Nearby Homes
- 3 Blueberry Hill Ln
- 0 Ballard Highland Marietta Unit 73391306
- 13 Clark St
- 203 Pleasant St
- The Majesty Plan at Constitution Village
- The Alexander Plan at Constitution Village
- The Countess Plan at Constitution Village
- Jasmine Glory Plan at Constitution Village
- 11 Voyagers Ln
- 638 Main St
- 8 Roberts Rd
- 116 Waverly St
- 24 Old Connecticut Path
- 34 Jodie Rd
- 25 Prospect St
- 15 Bellmore Rd
- 27 Travis Dr
- 8 Bellmore Rd
- 49 Prospect St
- 9 Olive St
- 11 Raymond Marchetti St Unit 11A
- 79 Raymond Marchetti St
- 7 Raymond Marchetti St Unit 1
- 9 Raymond Marchetti St Unit 9
- 7 Raymond Marchetti St
- 7-9 Raymond Marchetti St
- 17 Raymond Marchetti St
- 15 Raymond Marchetti St
- 72-74 Concord St
- 80 Concord St
- 20 Raymond Marchetti St
- 5 Alfred Rd
- 8 Raymond Marchetti St
- 76 Concord St
- 72 Concord St Unit 74
- 72 Concord St
- 72 Concord St Unit A
- 72 Concord St Unit B
- 72 Concord St Unit 72A
- 2 Alfred Rd