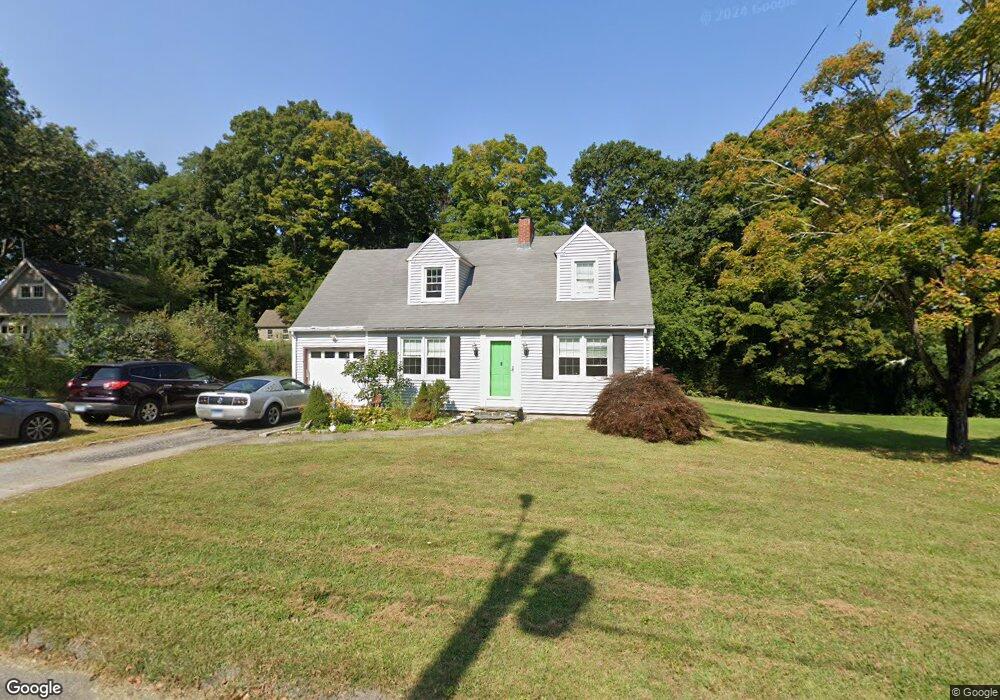
11 Read St Deep River, CT 06417
Estimated Value: $440,601 - $481,000
3
Beds
2
Baths
1,625
Sq Ft
$288/Sq Ft
Est. Value
About This Home
This home is located at 11 Read St, Deep River, CT 06417 and is currently estimated at $468,150, approximately $288 per square foot. 11 Read St is a home located in Middlesex County with nearby schools including Valley Regional High School.
Ownership History
Date
Name
Owned For
Owner Type
Purchase Details
Closed on
Jul 23, 2018
Sold by
Peterlik Thomas F and Rapp Emily
Bought by
Peterlik Thomas F
Current Estimated Value
Purchase Details
Closed on
Sep 9, 2015
Sold by
Peterlik Thomas and Forbes Amy D
Bought by
Peterlik Thomas and Rapp Emily
Home Financials for this Owner
Home Financials are based on the most recent Mortgage that was taken out on this home.
Original Mortgage
$198,000
Interest Rate
4.01%
Purchase Details
Closed on
Dec 3, 2004
Sold by
Byrum Jonathan and Byrum Cheryl
Bought by
Peterlik Thomas and Forbes Amy
Home Financials for this Owner
Home Financials are based on the most recent Mortgage that was taken out on this home.
Original Mortgage
$230,000
Interest Rate
5.69%
Purchase Details
Closed on
Aug 2, 2000
Sold by
Smith Jennifer L and Lewis Gregg
Bought by
Byrum Cheryl A and Byrum Jonathan W
Purchase Details
Closed on
Mar 30, 1998
Sold by
Calarco Richard A
Bought by
Smith Jennifer L and Lewis Gregg
Create a Home Valuation Report for This Property
The Home Valuation Report is an in-depth analysis detailing your home's value as well as a comparison with similar homes in the area
Home Values in the Area
Average Home Value in this Area
Purchase History
| Date | Buyer | Sale Price | Title Company |
|---|---|---|---|
| Peterlik Thomas F | -- | -- | |
| Peterlik Thomas | -- | -- | |
| Peterlik Thomas | $288,000 | -- | |
| Byrum Cheryl A | $179,900 | -- | |
| Smith Jennifer L | $154,900 | -- |
Source: Public Records
Mortgage History
| Date | Status | Borrower | Loan Amount |
|---|---|---|---|
| Previous Owner | Peterlik Thomas | $198,000 | |
| Previous Owner | Smith Jennifer L | $214,700 | |
| Previous Owner | Smith Jennifer L | $60,700 | |
| Previous Owner | Smith Jennifer L | $230,000 |
Source: Public Records
Tax History
| Year | Tax Paid | Tax Assessment Tax Assessment Total Assessment is a certain percentage of the fair market value that is determined by local assessors to be the total taxable value of land and additions on the property. | Land | Improvement |
|---|---|---|---|---|
| 2025 | $5,973 | $186,760 | $56,000 | $130,760 |
| 2024 | $5,861 | $186,760 | $56,000 | $130,760 |
| 2023 | $5,580 | $186,760 | $56,000 | $130,760 |
| 2022 | $5,412 | $186,760 | $56,000 | $130,760 |
| 2021 | $5,524 | $186,760 | $56,000 | $130,760 |
| 2020 | $5,059 | $168,700 | $48,090 | $120,610 |
| 2019 | $4,963 | $168,700 | $48,090 | $120,610 |
| 2018 | $4,963 | $168,700 | $48,090 | $120,610 |
| 2017 | $4,788 | $165,550 | $48,090 | $117,460 |
| 2016 | $4,558 | $165,550 | $48,090 | $117,460 |
| 2015 | $4,706 | $179,060 | $53,690 | $125,370 |
| 2014 | $4,634 | $179,060 | $53,690 | $125,370 |
Source: Public Records
Map
Nearby Homes
Your Personal Tour Guide
Ask me questions while you tour the home.