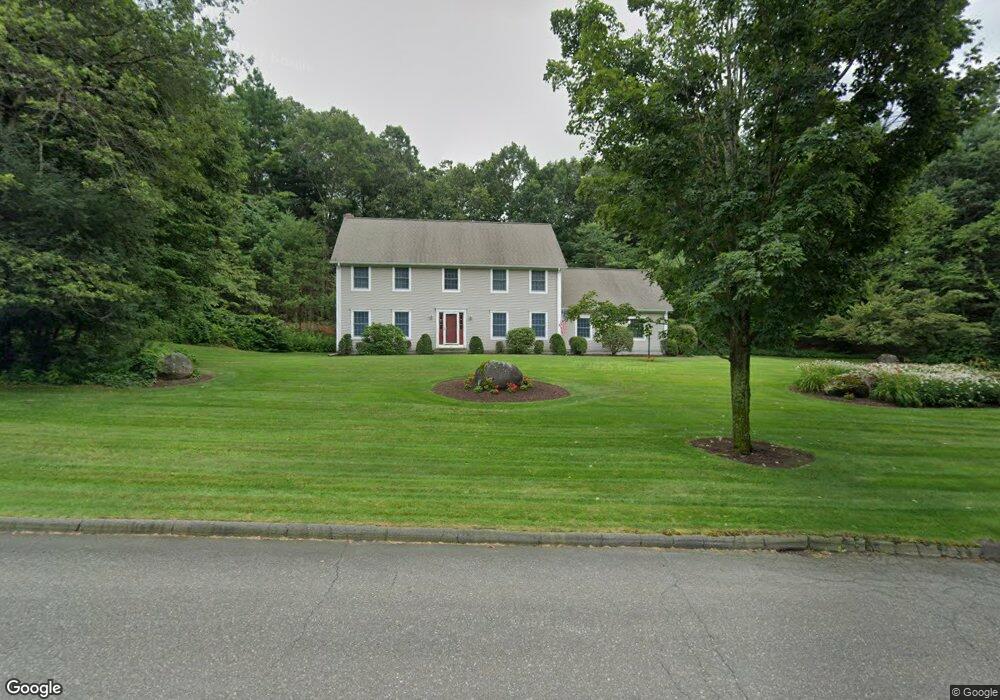
11 Red Gap Rd Wilbraham, MA 01095
Estimated Value: $646,609 - $785,000
4
Beds
3
Baths
2,828
Sq Ft
$252/Sq Ft
Est. Value
About This Home
This home is located at 11 Red Gap Rd, Wilbraham, MA 01095 and is currently estimated at $712,536, approximately $251 per square foot. 11 Red Gap Rd is a home located in Hampden County with nearby schools including Minnechaug Regional High School and Wilbraham & Monson Academy.
Ownership History
Date
Name
Owned For
Owner Type
Purchase Details
Closed on
Jun 10, 1996
Sold by
Wilbraview Lp
Bought by
Swain Douglas W and Swain Jodie T
Current Estimated Value
Home Financials for this Owner
Home Financials are based on the most recent Mortgage that was taken out on this home.
Original Mortgage
$50,000
Interest Rate
7.89%
Mortgage Type
Purchase Money Mortgage
Create a Home Valuation Report for This Property
The Home Valuation Report is an in-depth analysis detailing your home's value as well as a comparison with similar homes in the area
Home Values in the Area
Average Home Value in this Area
Purchase History
| Date | Buyer | Sale Price | Title Company |
|---|---|---|---|
| Swain Douglas W | $75,000 | -- |
Source: Public Records
Mortgage History
| Date | Status | Borrower | Loan Amount |
|---|---|---|---|
| Open | Swain Douglas W | $207,000 | |
| Closed | Swain Douglas W | $50,000 |
Source: Public Records
Tax History
| Year | Tax Paid | Tax Assessment Tax Assessment Total Assessment is a certain percentage of the fair market value that is determined by local assessors to be the total taxable value of land and additions on the property. | Land | Improvement |
|---|---|---|---|---|
| 2025 | $10,386 | $580,900 | $132,100 | $448,800 |
| 2024 | $9,983 | $539,600 | $132,100 | $407,500 |
| 2023 | $9,073 | $484,800 | $132,100 | $352,700 |
| 2022 | $9,073 | $442,800 | $132,100 | $310,700 |
| 2021 | $8,927 | $388,800 | $130,700 | $258,100 |
| 2020 | $8,701 | $388,800 | $130,700 | $258,100 |
| 2019 | $8,476 | $388,800 | $130,700 | $258,100 |
| 2018 | $8,456 | $373,500 | $130,700 | $242,800 |
| 2017 | $8,217 | $373,500 | $130,700 | $242,800 |
| 2016 | $8,063 | $373,300 | $144,700 | $228,600 |
| 2015 | $7,795 | $373,300 | $144,700 | $228,600 |
Source: Public Records
Map
Nearby Homes
Your Personal Tour Guide
Ask me questions while you tour the home.