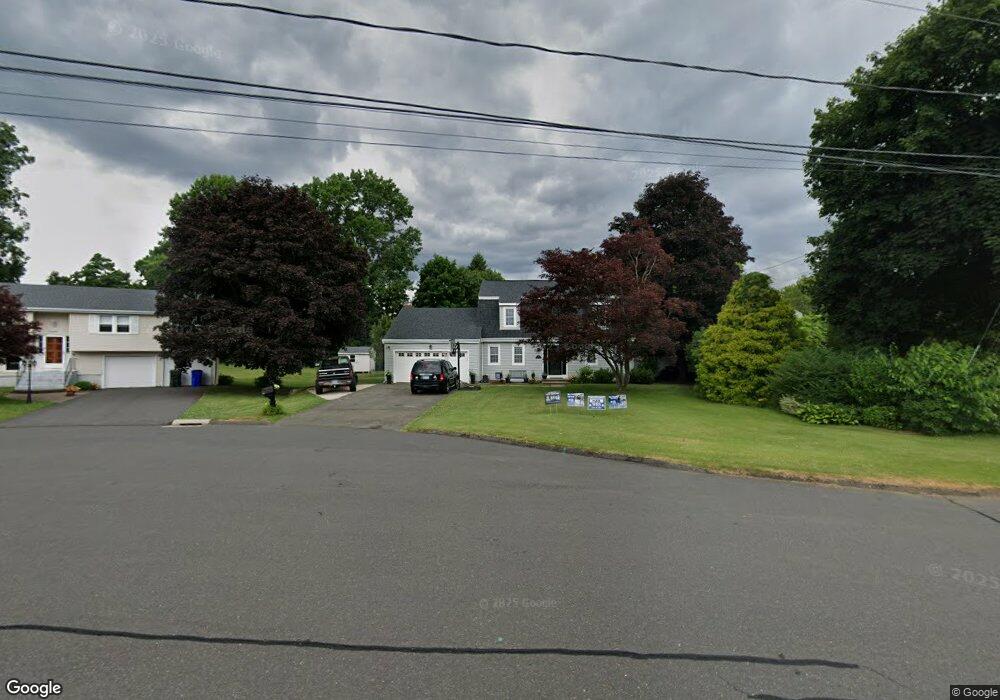
11 Rhodes Cir Wethersfield, CT 06109
Estimated Value: $514,768 - $609,000
3
Beds
3
Baths
1,980
Sq Ft
$283/Sq Ft
Est. Value
About This Home
This home is located at 11 Rhodes Cir, Wethersfield, CT 06109 and is currently estimated at $560,192, approximately $282 per square foot. 11 Rhodes Cir is a home located in Hartford County with nearby schools including Samuel B. Webb Elementary School, Silas Deane Middle School, and Wethersfield High School.
Ownership History
Date
Name
Owned For
Owner Type
Purchase Details
Closed on
Sep 30, 2005
Sold by
Faust Courtnie C and Spinola Steven R
Bought by
Prunier Wayne R and Elizabeth Prunier M
Current Estimated Value
Purchase Details
Closed on
May 22, 2002
Sold by
Mcleon Gary C and Mcleon Kathleen M
Bought by
Faust Courtnie G and Spinola Steven R
Create a Home Valuation Report for This Property
The Home Valuation Report is an in-depth analysis detailing your home's value as well as a comparison with similar homes in the area
Home Values in the Area
Average Home Value in this Area
Purchase History
| Date | Buyer | Sale Price | Title Company |
|---|---|---|---|
| Prunier Wayne R | $342,000 | -- | |
| Faust Courtnie G | $280,000 | -- |
Source: Public Records
Mortgage History
| Date | Status | Borrower | Loan Amount |
|---|---|---|---|
| Open | Faust Courtnie G | $40,000 | |
| Open | Faust Courtnie G | $244,000 |
Source: Public Records
Tax History Compared to Growth
Tax History
| Year | Tax Paid | Tax Assessment Tax Assessment Total Assessment is a certain percentage of the fair market value that is determined by local assessors to be the total taxable value of land and additions on the property. | Land | Improvement |
|---|---|---|---|---|
| 2025 | $13,157 | $319,180 | $99,960 | $219,220 |
| 2024 | $8,845 | $204,640 | $79,100 | $125,540 |
| 2023 | $8,550 | $204,640 | $79,100 | $125,540 |
| 2022 | $8,326 | $202,680 | $79,110 | $123,570 |
| 2021 | $8,243 | $202,680 | $79,110 | $123,570 |
| 2020 | $8,247 | $202,680 | $79,110 | $123,570 |
| 2019 | $8,257 | $202,680 | $79,110 | $123,570 |
| 2018 | $8,384 | $205,600 | $76,000 | $129,600 |
| 2017 | $8,177 | $205,600 | $76,000 | $129,600 |
| 2016 | $7,924 | $205,600 | $76,000 | $129,600 |
| 2015 | $7,852 | $205,600 | $76,000 | $129,600 |
| 2014 | $7,554 | $205,600 | $76,000 | $129,600 |
Source: Public Records
Map
Nearby Homes
- 104 Willow St
- 841 Ridge Rd
- 876 Ridge Rd
- 15 Grass Bonnet Ln
- 20 Gracewell Rd
- 828 Wells Rd
- 615 Ridge Rd
- 7 Barrington Dr Unit A
- 7 Barrington Dr Unit C
- 51 Olney Rd
- 268 Goff Rd
- 373 Prospect St
- 47 Forest Dr
- 219 Crest St
- 75 Cider Brook Dr
- 133 Wells Farm Dr
- 140 Edward St
- 0 Collier Rd
- 373 Wells Rd
- 101 Collier Rd