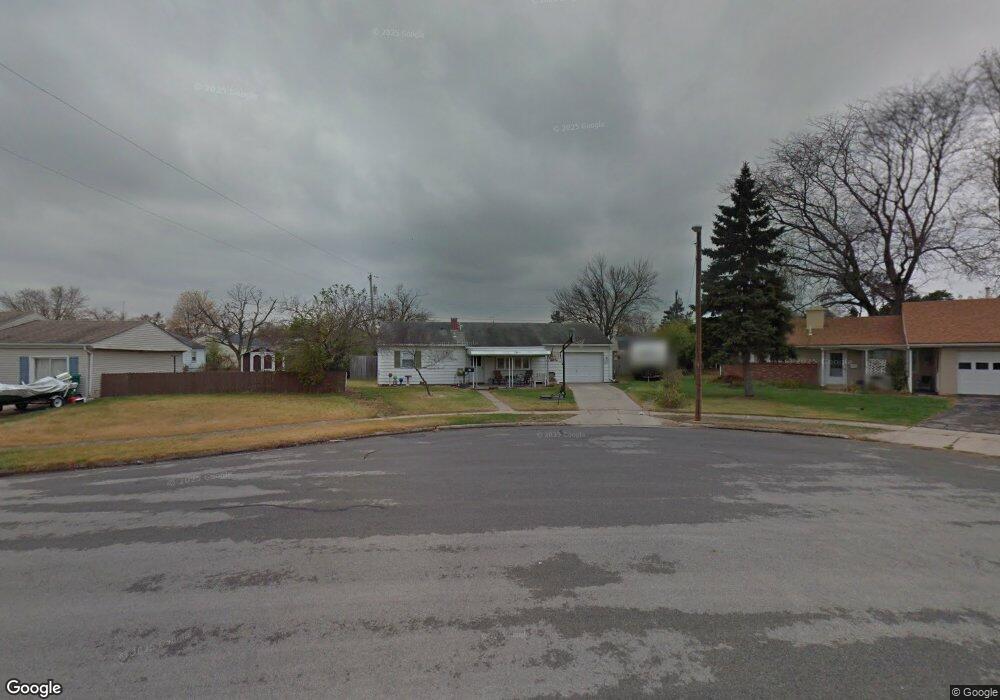
11 Richwood Ct Fairborn, OH 45324
Estimated Value: $132,000 - $156,000
3
Beds
1
Bath
816
Sq Ft
$174/Sq Ft
Est. Value
About This Home
This home is located at 11 Richwood Ct, Fairborn, OH 45324 and is currently estimated at $142,391, approximately $174 per square foot. 11 Richwood Ct is a home located in Greene County with nearby schools including Fairborn Primary School, Fairborn Intermediate School, and Fairborn Middle School.
Ownership History
Date
Name
Owned For
Owner Type
Purchase Details
Closed on
Jun 21, 2002
Sold by
Edge Mary H and Miller Barbara J
Bought by
Jackson Michael E
Current Estimated Value
Home Financials for this Owner
Home Financials are based on the most recent Mortgage that was taken out on this home.
Original Mortgage
$74,298
Outstanding Balance
$31,393
Interest Rate
6.8%
Mortgage Type
FHA
Estimated Equity
$110,998
Purchase Details
Closed on
Dec 14, 1998
Sold by
Burris Paul A and Burris Lillian J
Bought by
Burris Paul A and The Paul A Burris Revocable Living Trust
Create a Home Valuation Report for This Property
The Home Valuation Report is an in-depth analysis detailing your home's value as well as a comparison with similar homes in the area
Home Values in the Area
Average Home Value in this Area
Purchase History
| Date | Buyer | Sale Price | Title Company |
|---|---|---|---|
| Jackson Michael E | $74,900 | -- | |
| Burris Paul A | -- | -- |
Source: Public Records
Mortgage History
| Date | Status | Borrower | Loan Amount |
|---|---|---|---|
| Open | Jackson Michael E | $74,298 |
Source: Public Records
Tax History Compared to Growth
Tax History
| Year | Tax Paid | Tax Assessment Tax Assessment Total Assessment is a certain percentage of the fair market value that is determined by local assessors to be the total taxable value of land and additions on the property. | Land | Improvement |
|---|---|---|---|---|
| 2024 | $1,572 | $33,630 | $9,000 | $24,630 |
| 2023 | $1,572 | $33,630 | $9,000 | $24,630 |
| 2022 | $1,193 | $21,450 | $6,430 | $15,020 |
| 2021 | $1,210 | $21,450 | $6,430 | $15,020 |
| 2020 | $1,216 | $21,450 | $6,430 | $15,020 |
| 2019 | $1,140 | $20,170 | $6,200 | $13,970 |
| 2018 | $1,152 | $20,170 | $6,200 | $13,970 |
| 2017 | $1,126 | $20,170 | $6,200 | $13,970 |
| 2016 | $1,152 | $20,170 | $6,200 | $13,970 |
| 2015 | $1,097 | $20,170 | $6,200 | $13,970 |
| 2014 | $1,060 | $20,170 | $6,200 | $13,970 |
Source: Public Records
Map
Nearby Homes
- 849 Flintridge Dr
- 608 S Maple Ave
- 5 Marchmont Dr
- 97 Marchmont Dr
- 849 S Maple Ave
- 3 Holgate Ct
- 852 Princeton Ave
- 320 E Xenia Dr
- 66 S Central Ave
- 849 Princeton Ave
- 139 Hower Ln
- 860 Washington Ave
- 340 Holmes Dr
- 112 E Xenia Dr
- 20 Ramona Dr
- 59 S Wright Ave Unit 63
- 000 Morris Dr
- 43 Lindway Dr
- 1040 S Central Ave
- 1108 Lexington Ave