Estimated Value: $544,961 - $665,000
3
Beds
2
Baths
1,278
Sq Ft
$481/Sq Ft
Est. Value
About This Home
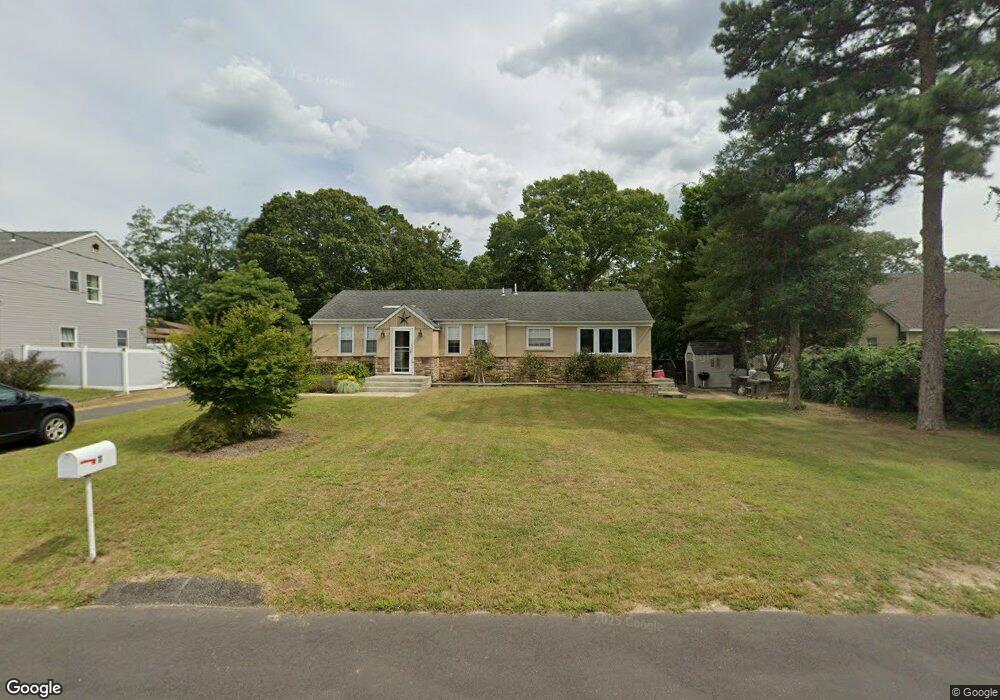
This home is located at 11 Robbins St, Brick, NJ 08724 and is currently estimated at $614,240, approximately $480 per square foot. 11 Robbins St is a home located in Ocean County with nearby schools including Midstreams Elementary School, Veterans Memorial Middle School, and Brick Township Memorial High School.
Ownership History
Date
Name
Owned For
Owner Type
Purchase Details
Closed on
Jun 6, 2011
Sold by
Cace Anthony S and Cace Lisa A
Bought by
Brown Thomas and Brown Cris
Current Estimated Value
Home Financials for this Owner
Home Financials are based on the most recent Mortgage that was taken out on this home.
Original Mortgage
$270,952
Outstanding Balance
$187,837
Interest Rate
4.75%
Mortgage Type
FHA
Estimated Equity
$426,403
Purchase Details
Closed on
Apr 30, 2008
Sold by
Nave Dorothy Ann
Bought by
Cace Anthony S and Cace Lisa A
Home Financials for this Owner
Home Financials are based on the most recent Mortgage that was taken out on this home.
Original Mortgage
$229,500
Interest Rate
6.35%
Mortgage Type
New Conventional
Purchase Details
Closed on
Mar 3, 2004
Sold by
Smetts Margaret L and Smetts Joseph S
Bought by
Smetts Margaret L
Create a Home Valuation Report for This Property
The Home Valuation Report is an in-depth analysis detailing your home's value as well as a comparison with similar homes in the area
Home Values in the Area
Average Home Value in this Area
Purchase History
| Date | Buyer | Sale Price | Title Company |
|---|---|---|---|
| Brown Thomas | $278,000 | Westcor Land Title Ins Co | |
| Cace Anthony S | $255,000 | First American Title Ins Co | |
| Smetts Margaret L | -- | None Available |
Source: Public Records
Mortgage History
| Date | Status | Borrower | Loan Amount |
|---|---|---|---|
| Open | Brown Thomas | $270,952 | |
| Previous Owner | Cace Anthony S | $229,500 |
Source: Public Records
Tax History
| Year | Tax Paid | Tax Assessment Tax Assessment Total Assessment is a certain percentage of the fair market value that is determined by local assessors to be the total taxable value of land and additions on the property. | Land | Improvement |
|---|---|---|---|---|
| 2025 | $6,590 | $252,500 | $132,200 | $120,300 |
| 2024 | $6,254 | $252,500 | $132,200 | $120,300 |
Source: Public Records
Map
Nearby Homes
- 17 East Trail
- 4 East Trail
- 21 Wayside Dr
- 74 Fairview Ave
- 13 Golden Rod Ct
- 1 Woodchuck Ln
- 982 Falkenberg Rd
- 32 Sleepy Hollow Dr
- 744 Pine Dr
- 746 Pine Dr
- 769 Pine Dr
- 94 Sleepy Hollow Dr
- 701 Barberry Dr
- 3 Metedeconk Rd
- 114 Basin Ave
- 24 Davos Rd
- 1648 Harvard Ave
- 1653 Tilford Blvd
- 241 Old Squan Rd
- 1651 Forge Pond Rd
- 7 Robbins St
- 15 Robbins St
- 85 Princeton Ave
- 89 Princeton Ave
- 5 Robbins St
- 19 Robbins St
- 8 Robbins St
- 12 Robbins St
- 6 Robbins St
- 16 Robbins St
- 91 Princeton Ave
- 21 Robbins St
- 75 Princeton Ave
- 22 Robbins St
- 90 Princeton Ave
- 51 Robbins St
- 2 Laurelhurst Dr
- 13 Callaghan Rd
- 15 Callaghan Rd
- 95 Princeton Ave
Your Personal Tour Guide
Ask me questions while you tour the home.