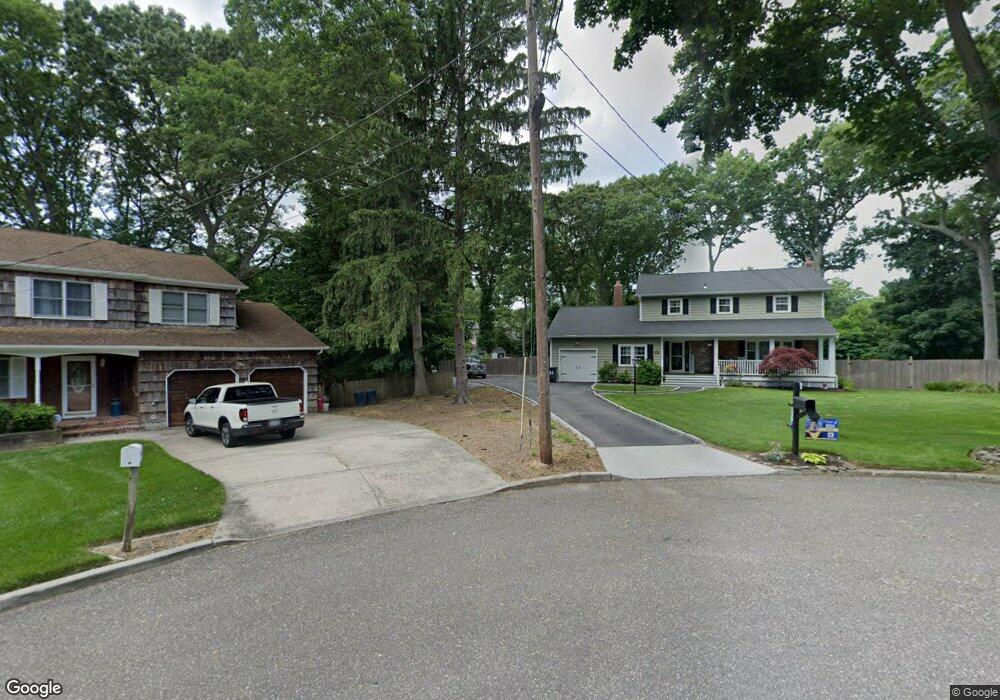
11 Robert Ct Shoreham, NY 11786
Estimated Value: $745,000 - $792,000
4
Beds
3
Baths
2,374
Sq Ft
$324/Sq Ft
Est. Value
About This Home
This home is located at 11 Robert Ct, Shoreham, NY 11786 and is currently estimated at $768,806, approximately $323 per square foot. 11 Robert Ct is a home located in Suffolk County with nearby schools including Miller Avenue School, Wading River School, and Albert G Prodell Middle School.
Ownership History
Date
Name
Owned For
Owner Type
Purchase Details
Closed on
Sep 18, 2017
Sold by
Libby Thomas and Libby Kelly
Bought by
Volz Peter and Volz Victoria
Current Estimated Value
Purchase Details
Closed on
May 15, 2003
Sold by
Blackford Gerard M and Blackford Noreen
Bought by
Libby Thomas and Libby Kelly
Home Financials for this Owner
Home Financials are based on the most recent Mortgage that was taken out on this home.
Original Mortgage
$300,000
Interest Rate
5.77%
Mortgage Type
Purchase Money Mortgage
Create a Home Valuation Report for This Property
The Home Valuation Report is an in-depth analysis detailing your home's value as well as a comparison with similar homes in the area
Home Values in the Area
Average Home Value in this Area
Purchase History
| Date | Buyer | Sale Price | Title Company |
|---|---|---|---|
| Volz Peter | $385,400 | -- | |
| Libby Thomas | $419,000 | -- |
Source: Public Records
Mortgage History
| Date | Status | Borrower | Loan Amount |
|---|---|---|---|
| Previous Owner | Libby Thomas | $300,000 |
Source: Public Records
Tax History
| Year | Tax Paid | Tax Assessment Tax Assessment Total Assessment is a certain percentage of the fair market value that is determined by local assessors to be the total taxable value of land and additions on the property. | Land | Improvement |
|---|---|---|---|---|
| 2024 | $13,963 | $3,465 | $325 | $3,140 |
| 2023 | $13,963 | $3,465 | $325 | $3,140 |
| 2022 | $12,341 | $3,465 | $325 | $3,140 |
| 2021 | $12,341 | $3,465 | $325 | $3,140 |
| 2020 | $12,445 | $3,465 | $325 | $3,140 |
| 2019 | $12,445 | $0 | $0 | $0 |
| 2018 | $10,989 | $3,465 | $325 | $3,140 |
| 2017 | $10,989 | $3,465 | $325 | $3,140 |
| 2016 | $10,922 | $3,465 | $325 | $3,140 |
| 2015 | -- | $3,465 | $325 | $3,140 |
| 2014 | -- | $3,920 | $325 | $3,595 |
Source: Public Records
Map
Nearby Homes
Your Personal Tour Guide
Ask me questions while you tour the home.