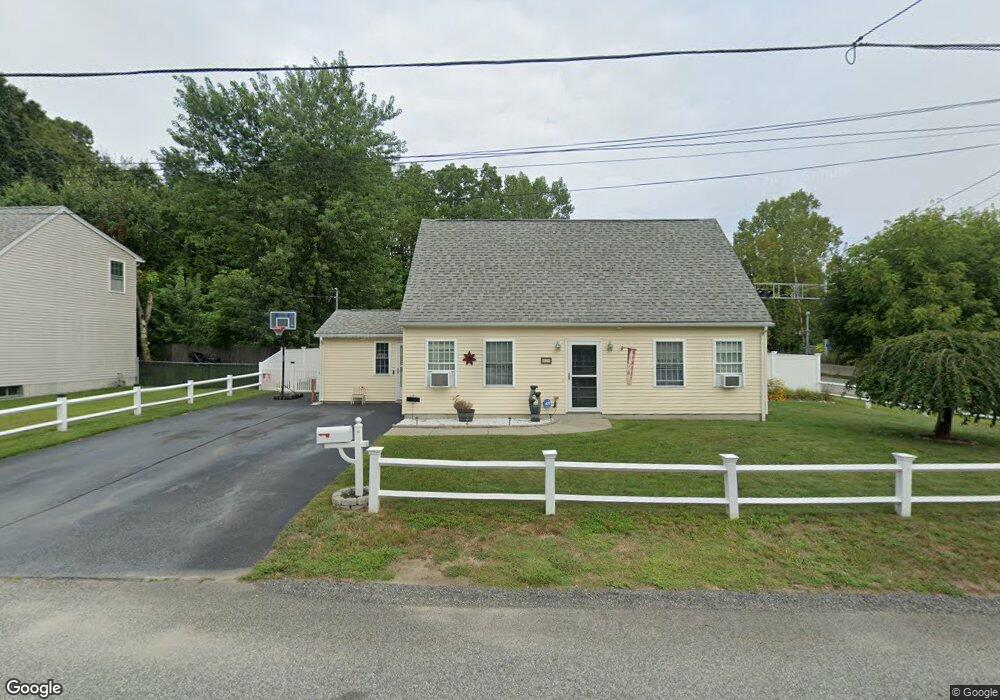
11 Roberta Ave Woonsocket, RI 02895
Globe District NeighborhoodEstimated Value: $403,000 - $468,000
3
Beds
2
Baths
1,690
Sq Ft
$250/Sq Ft
Est. Value
About This Home
This home is located at 11 Roberta Ave, Woonsocket, RI 02895 and is currently estimated at $423,174, approximately $250 per square foot. 11 Roberta Ave is a home located in Providence County with nearby schools including Woonsocket High School, Founders Academy, and Beacon Charter School.
Ownership History
Date
Name
Owned For
Owner Type
Purchase Details
Closed on
May 18, 2007
Sold by
Nycoland Development
Bought by
Innis Marc K and Innis Kim M
Current Estimated Value
Home Financials for this Owner
Home Financials are based on the most recent Mortgage that was taken out on this home.
Original Mortgage
$200,000
Interest Rate
6.18%
Mortgage Type
Purchase Money Mortgage
Create a Home Valuation Report for This Property
The Home Valuation Report is an in-depth analysis detailing your home's value as well as a comparison with similar homes in the area
Home Values in the Area
Average Home Value in this Area
Purchase History
| Date | Buyer | Sale Price | Title Company |
|---|---|---|---|
| Innis Marc K | $211,000 | -- | |
| Innis Marc K | $211,000 | -- |
Source: Public Records
Mortgage History
| Date | Status | Borrower | Loan Amount |
|---|---|---|---|
| Open | Innis Marc K | $7,990 | |
| Open | Innis Marc K | $217,490 | |
| Closed | Innis Marc K | $200,000 |
Source: Public Records
Tax History Compared to Growth
Tax History
| Year | Tax Paid | Tax Assessment Tax Assessment Total Assessment is a certain percentage of the fair market value that is determined by local assessors to be the total taxable value of land and additions on the property. | Land | Improvement |
|---|---|---|---|---|
| 2025 | $4,411 | $392,800 | $109,400 | $283,400 |
| 2024 | $4,135 | $284,400 | $97,000 | $187,400 |
| 2023 | $3,976 | $284,400 | $97,000 | $187,400 |
| 2022 | $3,976 | $284,400 | $97,000 | $187,400 |
| 2021 | $5,406 | $227,600 | $63,300 | $164,300 |
| 2020 | $5,462 | $227,600 | $63,300 | $164,300 |
| 2018 | $4,845 | $201,200 | $63,300 | $137,900 |
| 2017 | $4,506 | $149,700 | $47,700 | $102,000 |
| 2016 | $4,766 | $149,700 | $47,700 | $102,000 |
| 2015 | $5,476 | $149,700 | $47,700 | $102,000 |
| 2014 | $5,204 | $144,800 | $52,500 | $92,300 |
Source: Public Records
Map
Nearby Homes
- 27 Roberta Ave
- 4 Roberta Ave
- 20 Roberta Ave
- 55 Roberta Ave
- 40 Roberta Ave
- 268 Asylum St
- 298 Asylum St
- 282 Asylum St
- 73 Roberta Ave
- 168 Rockland Ave
- 89 Roberta Ave
- 90 Roberta Ave
- 0 Roberta Ave
- 105 Roberta Ave
- 96 Roberta Ave
- 203 Sunnyside Ave
- 109 Morse Ave
- 121 Roberta Ave
- 108 Roberta Ave
- 160 Asylum St